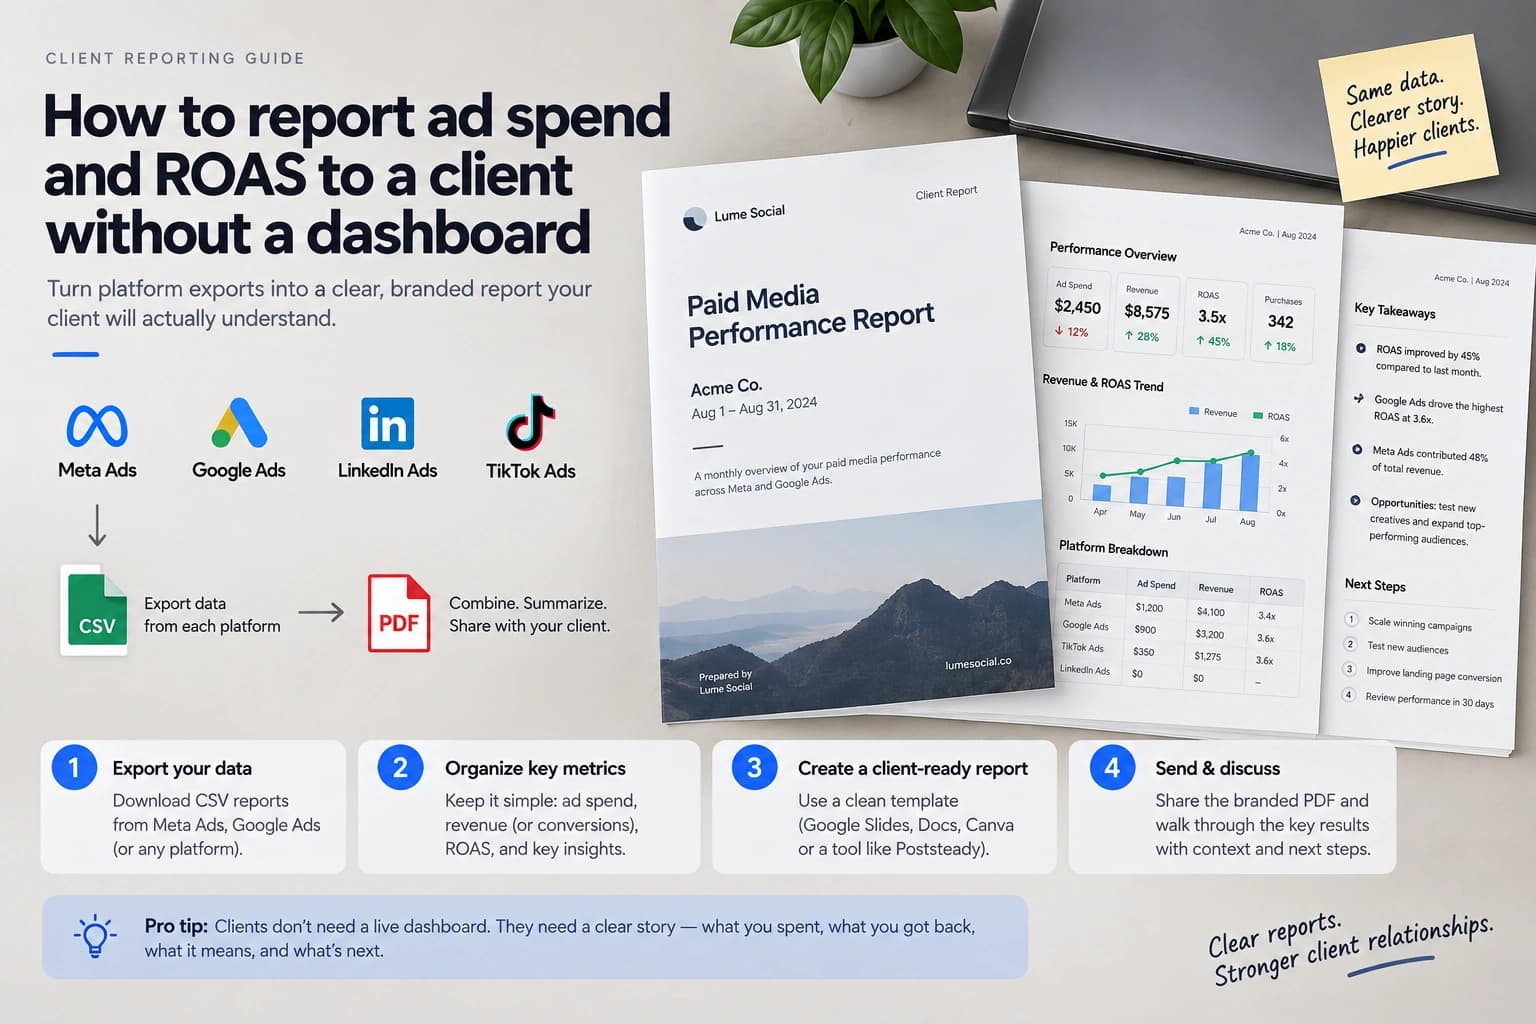

If you manage a client's boosted posts or ad campaigns alongside their organic content, they eventually ask the one question that matters: what did we spend, and what did we get back. Here's how to answer that from the exports you already download, on every platform that reports it differently.
Why this part of the report gets skipped
Most client-reporting advice online assumes you've connected a dashboard tool — something that pulls spend and ROAS out of the ad account automatically over an API. That's a fine setup if you have that access. A lot of freelancers don't, and a lot of the ones who could get it don't want it. Holding the keys to a client's ad account is a liability: you become the person who has to be available when something breaks, and you inherit a permissions relationship that outlives the engagement.
So the actual workflow, for a large share of people doing this work, is manual. You log into the ad platform, you set the date range, you export the CSV, and then you're holding a file with forty columns and no obvious way to turn it into something a client will read. Nobody writes about that half. The gap isn't "how do I read ROAS" — it's "I have the file, now what."
There's a second reason this section gets dropped: paid and organic usually live in different tools, so they end up in different documents, or paid gets a sentence at the bottom of the organic report. That's a mistake commercially. Spend is the only number in the report your client is definitely tracking on their own side, because it left their bank account. A report that covers everything except the money is a report about the least consequential half of the month.
Where spend and ROAS actually come from
Each platform reports the same idea — money in, value out — under a different name, in a different place, and with a different default. Here's where each one actually hides it.
- Meta Ads Manager — the default column view only shows Amount Spent, Reach, Impressions, CPM, Link Clicks, CPC and CTR. ROAS is not on it. You have to switch to a conversion-focused column set (Results, Cost per Result, Purchase ROAS, Amount Spent) before it appears, then export from the Reports menu. If you export on defaults and wonder where the return number went, this is why.
- Google Ads — there is no column literally labeled "ROAS." It's called Conv. value / cost, added from Modify Columns under the Conversions group. Google shows it as a raw ratio, not a percentage — so 3.4 means 340%. If your client is used to seeing a percentage, convert it before it goes in the report rather than pasting 3.4 and hoping.
- TikTok Ads Manager — the friendliest of the four. Spend, CPA, Cost per Result and ROAS all sit in the default dashboard columns, and you export through Reporting as a custom report in CSV or XLSX.
- LinkedIn Campaign Manager — ROAS is visible on the Conversions tab and exports cleanly. It is also the one you should trust least. See the next section.
One habit worth building across all four: export the previous period at the same time. Every number in this post is more useful as a comparison than as an absolute. A ROAS of 3.4x means nothing on its own — a client can't tell if that's good. A ROAS of 3.4x against last month's 2.1x is a story, and it takes ten extra seconds to pull while you're already in there.
The LinkedIn ROAS trap
LinkedIn Campaign Manager natively tracks form fills, not deal value. Its ROAS column is only meaningful if your client is passing real conversion value back to LinkedIn from their CRM. Without that, the "conversion value" sitting underneath that ROAS figure is a lead count wearing a currency symbol.
This matters because the number still looks completely normal. It exports as a clean decimal, it sits in a column called the right thing, and nothing in the file tells you it's measuring the wrong quantity. If you don't know whether the client has a CRM integration feeding LinkedIn, the honest move is to ask before the number goes in the report — and if the answer is no, report the lead count and cost per lead instead, which are real, rather than a ROAS that isn't.
A number that looks right and measures the wrong thing is worse than a missing number. The missing one prompts a question. The wrong one gets quoted back to you in three months.
When two systems report different numbers
Sooner or later a client will tell you their Shopify revenue doesn't match the conversion value in your report, or that their Google Ads conversions don't match GA4. Your instinct will be that you made an error. Usually you didn't.
Ad platforms attribute a conversion back to the click that caused it, inside an attribution window that each platform sets independently. If someone clicks an ad on the 28th and buys on the 3rd, Meta may count that sale in the month of the click while the client's own store counts it in the month of the purchase. Both are internally consistent. Neither is wrong. They're answering slightly different questions and the difference lands hardest at month boundaries — exactly where your reporting period sits.
The way to handle this is not to reconcile it silently. Pick one source, name it in the report, and stay on it every month. "Conversion figures are as reported by Meta Ads Manager" is one line, and it converts a future argument into a footnote. What you must not do is quietly switch sources between months because one looked better — that's how a client loses confidence in the whole document.
Why a rate should never be imported
Here's a failure mode that catches people building reports by hand in a spreadsheet. You export three campaigns, each with its own ROAS column, and you need one ROAS for the report. The obvious move is to average the three. That answer is wrong, and it's wrong in a direction that flatters small campaigns.
A rate can't be summed or averaged across rows, because each row's rate has a different denominator behind it. A campaign that spent $50 and returned $250 has a 5x ROAS. One that spent $5,000 and returned $10,000 has 2x. The average of those is 3.5x. The true blended figure is $10,250 divided by $5,050, which is about 2.03x. The average isn't slightly off — it nearly doubles the result, because it gives a $50 campaign the same vote as a $5,000 one.
The rule that falls out of this: sum the raw ingredients, then divide once at the end. Spend and conversion value add up across rows. ROAS, CPA, CPC, CPM and CTR do not — they get computed from the summed totals, one time, at the level you're reporting at.
How Poststeady reads the export
Drop any of those four exports into Poststeady and it recognizes the format automatically, off exactly the column shapes described above: Amount Spent next to Link Clicks reads as Meta, Cost next to Conv. rate reads as Google, Video Views next to Cost reads as TikTok, Amount Spent (USD) or Follows next to Impressions reads as LinkedIn. You don't tell it what the file is; it tells you, and you can correct it if it's wrong.
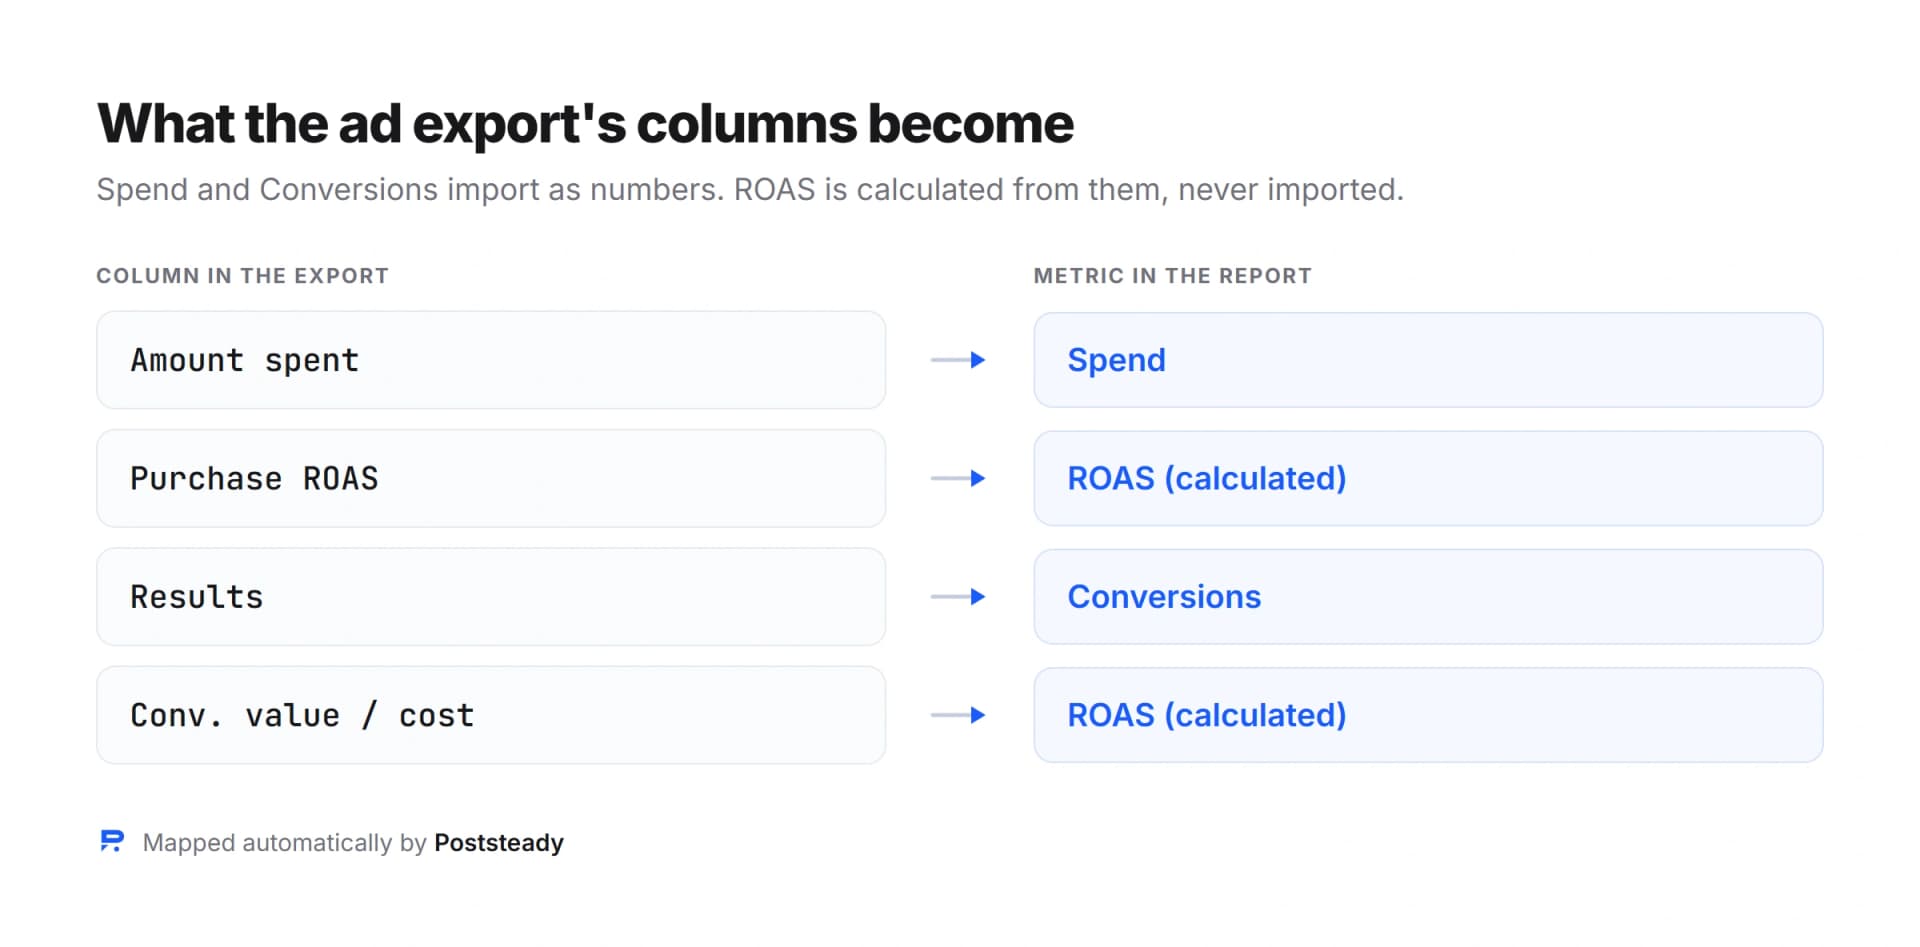
That last distinction is the important one. Spend and Conversions import as raw numbers from the file. ROAS, CPA, CPC and CPM are never imported at all — they're calculated from the period's totals every time the report renders, using exactly the sum-then-divide rule from the previous section. It's the same reason engagement rate is read-only in the metrics step: storing a copy of a rate creates a second number that can contradict the one printed next to it, and reconciling those two is a job nobody wants.
If a report has no paid metrics at all, the whole spend section simply doesn't appear. A purely organic client doesn't get an empty card with a dash in it.
How to present it so the client trusts it
Put spend and ROAS on the same page as the outcome they bought, not in an appendix. A client reading "$4,672 spent, 3.76x ROAS" immediately wants to know what that 3.76 is made of — so show conversions and conversion value underneath it. The ratio stops being something they have to take on faith and becomes something they can check.
Spend: $4,672. ROAS: 3.76x. Conversions: 248. CPA: $18.84.
We spent $4,672 and it returned $17,566 — 3.76x, up from 2.9x in July. Cost per conversion dropped to $18.84 because the retargeting set finally had enough audience to work with.
The second version isn't longer because it's padded. It's longer because it answers the two questions the first version provokes: compared to what, and why. A client who gets those answers in the document doesn't need to email you for them.
Say the caveats out loud, too. If the LinkedIn ROAS is unreliable because there's no CRM feeding it, write that in one sentence rather than omitting the number and hoping nobody asks. Clients forgive a stated limitation. They don't forgive discovering one themselves.
The monthly checklist
- Export the current period and the previous one, from every ad platform in play.
- On Meta, switch to a conversion column set first — the default view has no ROAS.
- On Google, add Conv. value / cost, and decide whether the client sees 3.4 or 340%.
- Check whether LinkedIn conversion value is real CRM data before reporting its ROAS.
- Never average a rate across campaigns. Sum spend and value, divide once.
- Name your source for conversion figures in the report, and keep it the same next month.
- Put spend, conversions and ROAS on one page, with a sentence explaining the movement.
None of this requires access to your client's ad accounts, a connected dashboard, or a tool that costs more than the retainer justifies. It requires the export you can already pull and a consistent way of turning it into a page.
Turn this month's ad export into a report
Upload the CSV from Meta, Google, TikTok or LinkedIn and get spend, conversions and ROAS on a branded page — free for 2 reports a month.