
Followers and engagement rate tell a client their content is working. Sessions and Users tell them it's working on something they actually care about — people who clicked the bio link and landed on the site. If you've never pulled a GA4 export for a report before, here's the whole path, including the one rename that trips people up.
Why a social report needs website data
A follower count is proof of an audience. It isn't proof that the audience does anything. That distinction matters most at exactly the moment your engagement is under review — when a client is deciding whether the retainer is worth renewing, and someone in the room asks what all this activity is actually for.
The honest answer usually lives outside the social platform entirely. Instagram can tell you 4,000 people saw a post and 40 tapped the link. It can't tell you what happened next. Whether those 40 people bounced in three seconds or read two pages and signed up for something is a question only the client's own analytics can answer, and answering it is what moves your report from "here's what I did" to "here's what it produced."
This is also the section that protects you in a bad month. Reach can fall while the traffic that matters holds steady — a smaller number of better-targeted people clicking through. Without the website side, a reach dip is just a reach dip. With it, you can show that the part connected to revenue didn't move.
The tagging that has to happen first
There's a prerequisite nobody mentions until it's too late: if the links aren't UTM-tagged, GA4 can't reliably tell social traffic apart from everything else. Untagged clicks scatter into direct and referral, and you end up reporting a number that includes people who typed the URL in from a business card.
This is a one-time setup on the client's side, and it's worth pushing for in the first month rather than the sixth. Tag the bio link, tag story links, tag anything you put in a caption. Once it's in place the traffic shows up correctly every month without anyone touching it again — and until it's in place, be careful about claiming credit for traffic you can't actually attribute.
If you've inherited an account where this was never done, say so in the report rather than reporting total site traffic as though social caused it. "Link tagging goes live this month, so next month's report will separate social traffic properly" is a fine sentence. It's also a small, visible improvement you made.
How to get the data out of GA4
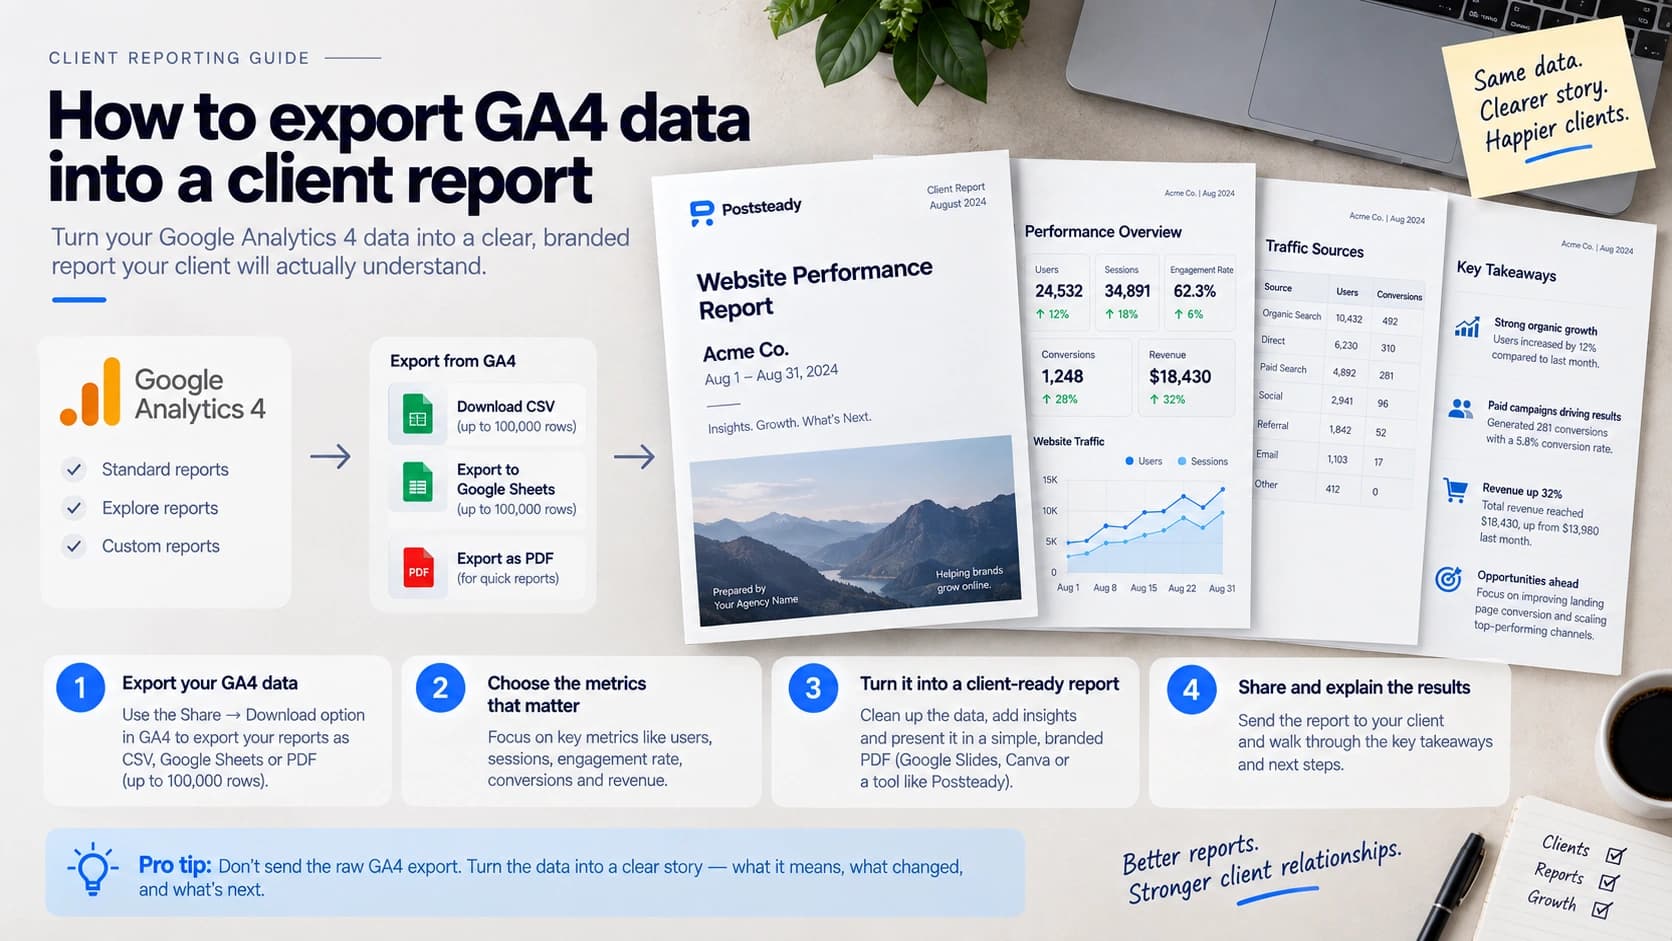
Open the report you want, click Share this report in the top right, choose Download File, and pick CSV. That's the whole export — it's less buried than most platforms.
Two limits are worth knowing before you build a monthly habit around it. A downloaded report tops out at 100,000 rows, which you will not hit on a normal client but will hit if you export something page-level on a large site. And you can't combine two different GA4 reports into a single file: an acquisition view and a landing-page view come out as two separate CSVs. That second limit shapes how you should work — pick the one report that answers the client's question rather than exporting several and trying to stitch them together afterwards.
As with any export, pull the previous period at the same time. A sessions figure with nothing to compare it against is a number your client has no way to judge.
The 2024 rename that trips up a fresh export
If you haven't touched GA4 in a while, the export won't say "Conversions" anymore. Google renamed it to Key events in March 2024. Same tracked action, new label — but there's a real conceptual split underneath the rename, and it's the source of a recurring client question.
A key event is what GA4 tracks happening on the client's site. A conversion is what gets imported into Google Ads to optimize campaigns against. They're now different words for different jobs, and the two counts can legitimately disagree because they use different attribution windows. So when a client points out that their GA4 export and their Google Ads numbers don't match for the same purchases, that isn't an error in either report — it's two systems counting the same event by different rules.
The practical handling is the same as for any cross-system discrepancy: name your source in the report and stay on it. "Key events as reported in GA4" takes one line and prevents a recurring conversation.
Which numbers actually belong in the report
GA4 will happily give you dozens of metrics. Most of them are for someone whose full-time job is the website, not for a social report. Three earn their place:
The headline number. One person visiting three times is three sessions, which is the right unit for measuring whether content drove activity.
Sessions divided by users tells you whether you reached a lot of people once, or a few people repeatedly. Both can be good; they're different stories.
The one that answers 'are we reaching anyone new, or recirculating the same followers?' — usually the most persuasive figure in the section.
Resist the urge to add bounce rate and average session duration because they're available. They invite a conversation about website quality, which is someone else's remit and not something your social work controls. Report what your work moved.
How Poststeady reads the export
Drop the CSV in and Poststeady fingerprints it as a GA4 export off exactly the shape described above: either a Key events column, or Sessions sitting next to Active users. No ad platform reports those two side by side, so that combination is unambiguous — it doesn't have to guess.
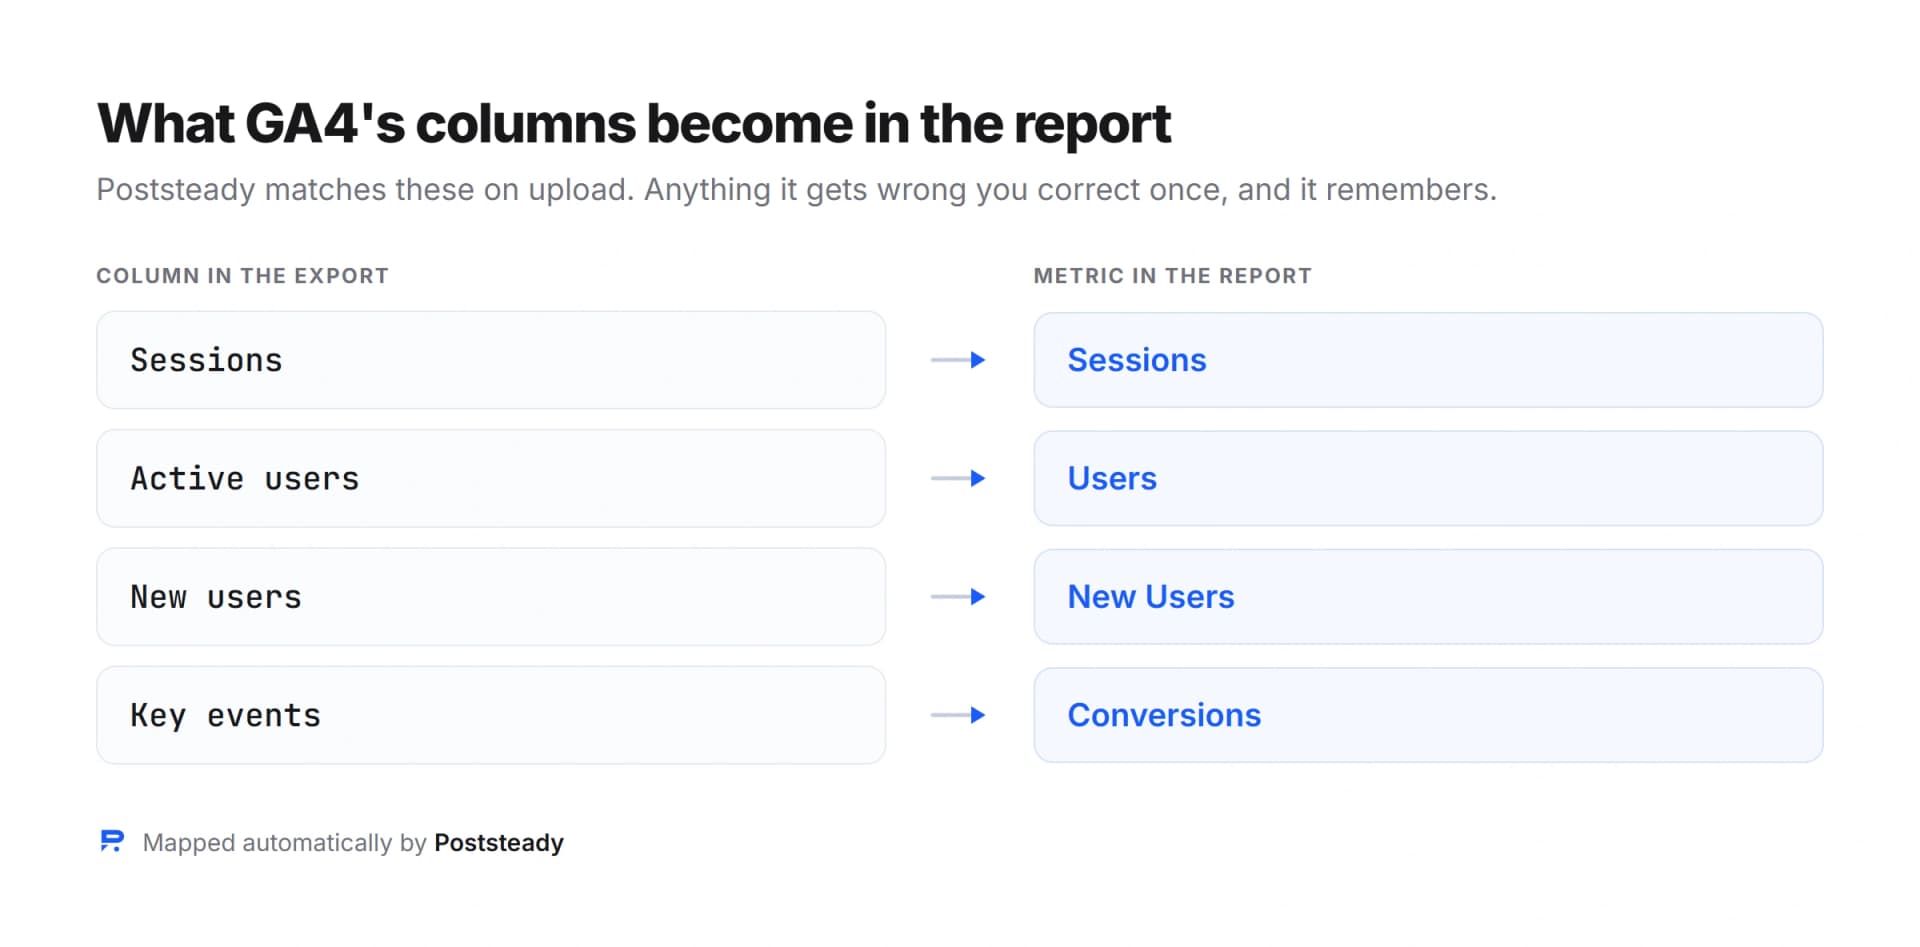
From there Sessions, Users and New Users map to their own stored metrics, kept separate from the social platform numbers already in the report. That separation is deliberate: a client seeing follower growth and site traffic on the same page should never be left wondering whether one has been folded into the other.
One honest caveat on Users
Poststeady sums metrics across the rows you upload, the same way it sums reach or impressions from a social export. Sessions add up cleanly that way — a session is a session regardless of which row it landed on.
Users can over-count slightly if you're uploading a page-level GA4 export, because the same visitor who viewed two pages appears as a user on both rows. There's no clean way around this from a flat CSV; deduplicating would need the underlying event data, which the export doesn't contain. It's the same approximation you'd be making by hand in a spreadsheet, and it's small on a normal client.
The practical answer: export at the acquisition or channel level rather than the page level when you can, since that gives you one row per traffic source instead of one per page. And if you are working from a page-level file, round the user figure in what you tell the client rather than quoting it to the digit.
The monthly checklist
- Confirm the bio and story links are UTM-tagged — without it the rest is guesswork.
- Export at acquisition or channel level, not page level, to keep the Users figure clean.
- Share this report → Download File → CSV, for the current period and the previous one.
- Expect Key events, not Conversions — and don't expect it to match Google Ads exactly.
- Report Sessions, Users and New Users. Leave bounce rate to the web team.
- Name GA4 as your source in the report, and use the same source next month.
Six lines of process, and the section it produces is usually the one the client reads twice — because it's the only part of the report that connects what you posted to what happened on the thing they actually sell from.
Put site traffic next to this month's social numbers
Upload the GA4 export alongside your platform CSVs and get Sessions, Users and New Users on the same branded report — free for 2 reports a month.