
Sprout Social has more than one report that looks like it answers "how did this month go," and one of them is quietly answering a different question. Pull the wrong one for a client report and the numbers are wrong in a way that's almost impossible to spot by eye.
The report that quietly lies about the month
Sprout's own support team has a dedicated help article for this, which tells you how often it comes up: Profile Performance and Post Performance reports showing different numbers for what looks like the same period.
The reason is that the two reports measure time differently. Profile Performance is scoped to the reporting period you pick — if you select May, you get May's activity, full stop. Post Performance is scoped to lifetime data on posts published in that period: pick May, and you get every post published in May along with every interaction those posts have ever received, including a like that lands in July. That like shows up in your "May" Post Performance numbers, two months after the fact, and it will keep showing up every time you re-pull that report.
A post published in May with engagement still trickling in during July isn't a June or July number in Post Performance — it's still counted as May's, forever. Re-export the same "May" report in August and the total has grown, even though May is long over.
This is the trap the keyword "which Sprout export for a client report" is really asking about, whether the person typing it knows it or not. Two reports, same date range selected, genuinely different totals — and nothing in either file flags which kind of number you're holding.
Which report is actually for a monthly client report
Profile Performance is the one you want for a standard monthly report. It's scoped to the calendar period, which is the same assumption every other part of your report is making — reach, impressions and follower growth for June should mean June, not "posts published in June, counted forever."
Post Performance still has a job. It's the right tool for "which posts performed best," a top-performing-content section, or a content-strategy retrospective where lifetime value is genuinely what you're measuring. What it's wrong for is standing in as this month's headline numbers — using it there silently inflates every month that still has posts accumulating engagement, which in practice is every recent month.
If your report needs both — period totals for the top of the page, top posts further down — pull both reports and keep them in their own lanes. Don't try to reconcile Post Performance's total against Profile Performance's total; they're not supposed to match, and chasing that match is time spent solving a problem that isn't there.
Where the export lives
Reports sits in the left-hand navigation. Pick the report type — Profile Performance for the monthly numbers — set your filters and date range, then use Share to download. CSV and PDF are the two export formats; there's no native PowerPoint export, which some competing tools do offer, so if the report needs to land in slides you're either exporting PDF and screenshotting, or building the deck from the CSV numbers yourself.
All Metrics, Table View, or Custom
If the workspace has the Premium Analytics add-on, the CSV export offers three modes, and picking the wrong one either drowns you in columns or leaves out the one you needed.
Every available column regardless of what's on screen. This is where the "up to 50 columns" reputation comes from — useful as a one-time audit, unwieldy as a monthly habit.
Exports exactly the columns you've configured the on-screen table to show. The lowest-friction option once you've set the table up the way you want it once.
Choose exactly which columns land in the file, whether or not they're currently shown on screen — the option for a report that needs a fixed column set every month regardless of how the dashboard view is configured that day.
For a recurring client report, Custom is worth the ten minutes it takes to set up once. It's the only mode that guarantees next month's file has the same columns in the same order as this month's, independent of anyone fiddling with the on-screen table in between.
Why Inbox Export isn't what you want
Sprout also has an Inbox Export, and the name is close enough to "analytics export" that it's worth ruling out explicitly. It isn't a performance report at all — it exports message and conversation thread data: completion status, permalinks, parent-post context for comment threads on platforms like TikTok and YouTube. It's built for customer-service auditing, not for a client performance report. If you land on it while looking for engagement numbers, you're one menu item away from where you need to be, not in the wrong tool entirely.
Other things that trip people up
- Sprout's own numbers can differ from what you see natively on Instagram or Facebook, because attribution and counting windows aren't identical across systems. Sprout has a support article on this too — it's expected drift, not a bug in either system, and the fix is the same as with any cross-platform discrepancy: name your source and stay on it.
- Column names in the CSV don't always match the on-screen labels exactly, especially once you're in Custom export mode picking metrics by their underlying name rather than their display name. Check a fresh export against the dashboard the first time you set up a new client, not every month.
- The three export modes only exist with Premium Analytics. Without that add-on, what you get is a simpler, fixed export — know which tier your client is on before you promise a specific column set.
How Poststeady reads the export
Sprout doesn't have its own dedicated fingerprint in the importer yet — a Sprout Profile Performance export is recognised by the same shape as Buffer and other third-party social analytics tools: engagement rate sitting next to followers is the tell, and the importer's own comment names Buffer and Sprout Social directly as the exports this rule was built from.
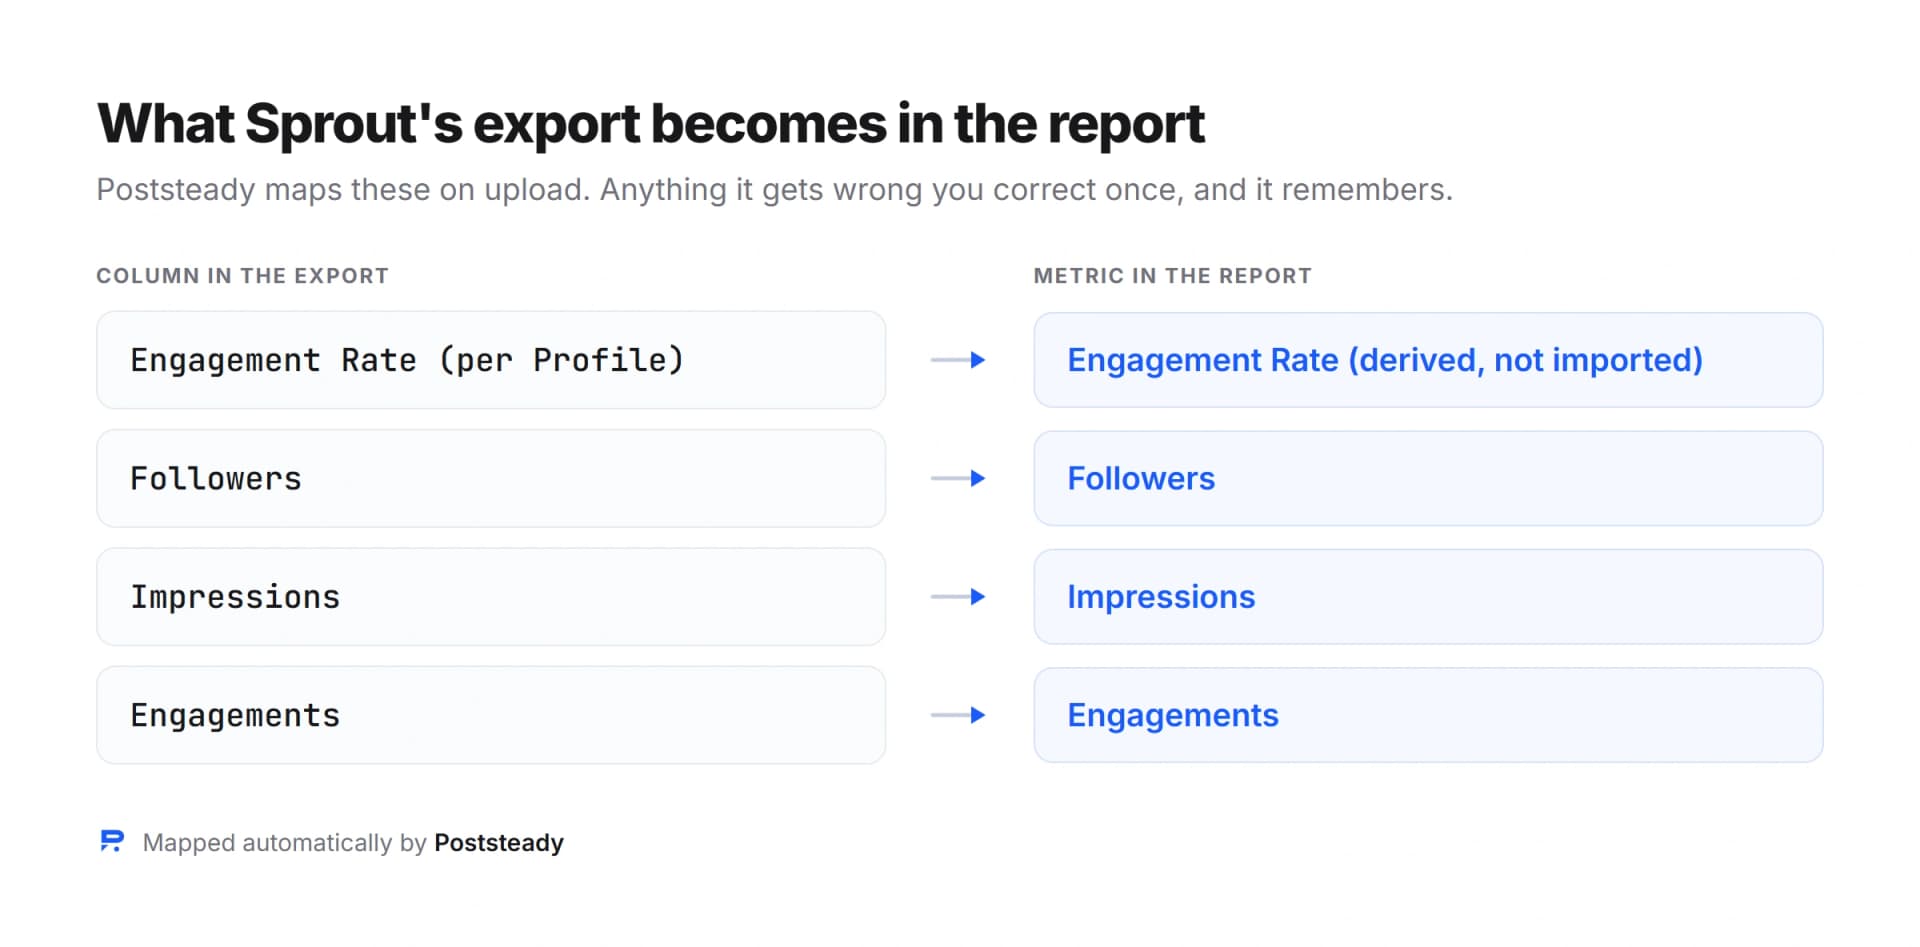
Followers and new followers import as their own stored columns. Engagement rate is never one of them — like every other platform in this series, it's calculated from engagements and reach at render time rather than read from the file, so the rate printed in the report can't drift from the two numbers sitting next to it. That matters more than usual here, because Sprout's own engagement-rate formula and the one you'd derive by hand don't always agree, and a stored copy of Sprout's version would be one more number a client could ask you to reconcile.
No API access to the client's Sprout workspace is needed at any point — the CSV you already export by hand is the whole input, whichever of the three modes it came from.
The monthly checklist
- Pull Profile Performance for period totals, not Post Performance.
- If you need top-performing posts too, pull Post Performance separately and don't reconcile it against Profile Performance's total.
- Use Custom export mode if you're on Premium Analytics, so the column set is stable month to month.
- Ignore Inbox Export — it's message data, not performance data.
- Rename the file with client, month and report type on the way out.
- Check a new client's first export against the dashboard once, to catch any column-name mismatch early.
The distinction that saves the report is one sentence long: period totals from Profile Performance, top content from Post Performance, and never let one stand in for the other.
Turn that export into a client report
Upload the CSV you just downloaded and get a branded three-page report, with the summary written for you to edit.