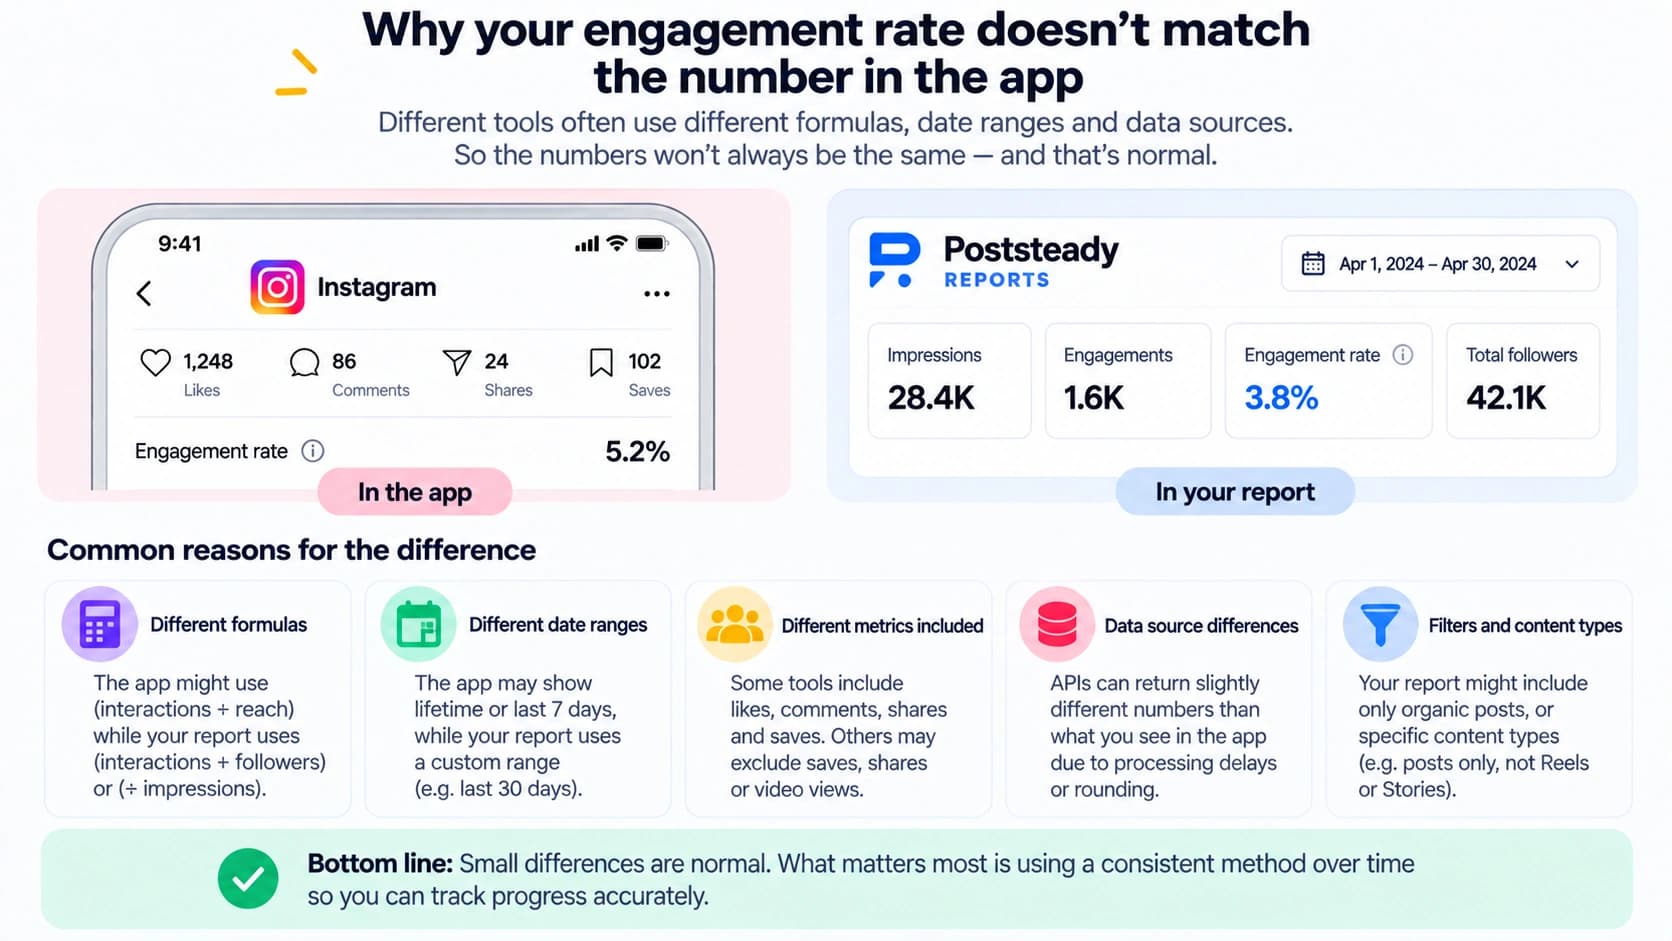

"The app says 4.2% and your report says 2.8% — which one's right?" Neither is wrong. There is no single, official "engagement rate" that every tool computes the same way, including the platform's own app half the time. Here's what's actually behind the mismatch, and the one line that ends the conversation.
The question, exactly as the client asks it
It never comes as "what denominator did you use." It comes as a screenshot and a question mark. Answering it well means knowing, before it happens, whether the platform even has a number to compare you to — and most of the time it doesn't.
Instagram doesn't have a native number to disagree with
Instagram's own Insights dashboard doesn't show a calculated engagement rate anywhere. It shows raw totals — interactions, reach, follower count — under Overview, and leaves the division up to you. So if a client says "Instagram shows a different number," Instagram isn't the source of that number. It came from somewhere else: their own quick math, a competitor's report, or a browser extension — each with its own formula.
LinkedIn does — and it's not the one you're using
LinkedIn is the exception. Its Page analytics export carries an actual Engagement Rate column, and LinkedIn's own definition for it is total engagements divided by impressions — reactions, comments, reposts and clicks over how many times the content was shown, not how many people it reached.
If your report calculates engagement rate off reach instead — which most reporting tools do, because reach is the more honest "how many people" number — you'll get a real, consistently different figure from LinkedIn's own column, even reading the exact same post. That's not an error on either side. It's two legitimate formulas with two different denominators.
Tools don't agree with each other either
It's not just the platform versus your report. One test ran the same Instagram creator's numbers through five engagement rate calculators on the same day — Phlanx, inBeat, HypeAuditor, Keyhole and GRIN — and got a spread from 1.07% to 4.50% among the tools that returned a sane number at all, with one outlier calculating over 100% and clearly broken. Hootsuite's own guide to the metric lists six different accepted formulas side by side — by reach, by impressions, by followers, daily, by video views, cost-per-engagement — without saying which one produces the benchmark numbers it publishes elsewhere.
So "which tool is right" isn't a fair question. Every tool is right, for its own formula. The only thing that's wrong is not saying which one you used.
Half the time, "the app" isn't the app
Worth checking before you dig into formulas: ask what the client actually looked at. Since Instagram itself doesn't surface a rate, "the app" is frequently a different report, a rival agency's proposal, or a number the client half-remembers from a call. That's a five-second question that saves you defending a mismatch that was never really about your report.
What to actually say
- Name your denominator on the report itself, once — "Engagement rate (of reach)" — so the question mostly doesn't come up.
- When it does: "There's no single engagement rate formula across platforms or tools — ours is engagements over reach, consistently, every month, so the trend line is comparable even if a single number doesn't match a different tool's."
- If it's LinkedIn specifically: "LinkedIn's own number divides by impressions, ours by reach — reach is the more honest 'people' number, which is why ours usually reads a bit higher."
- Never chase a match with a different tool by changing your formula mid-relationship. A rate that moves target every few months is worse than one that's honestly a different number from someone else's.
How Poststeady picks a number
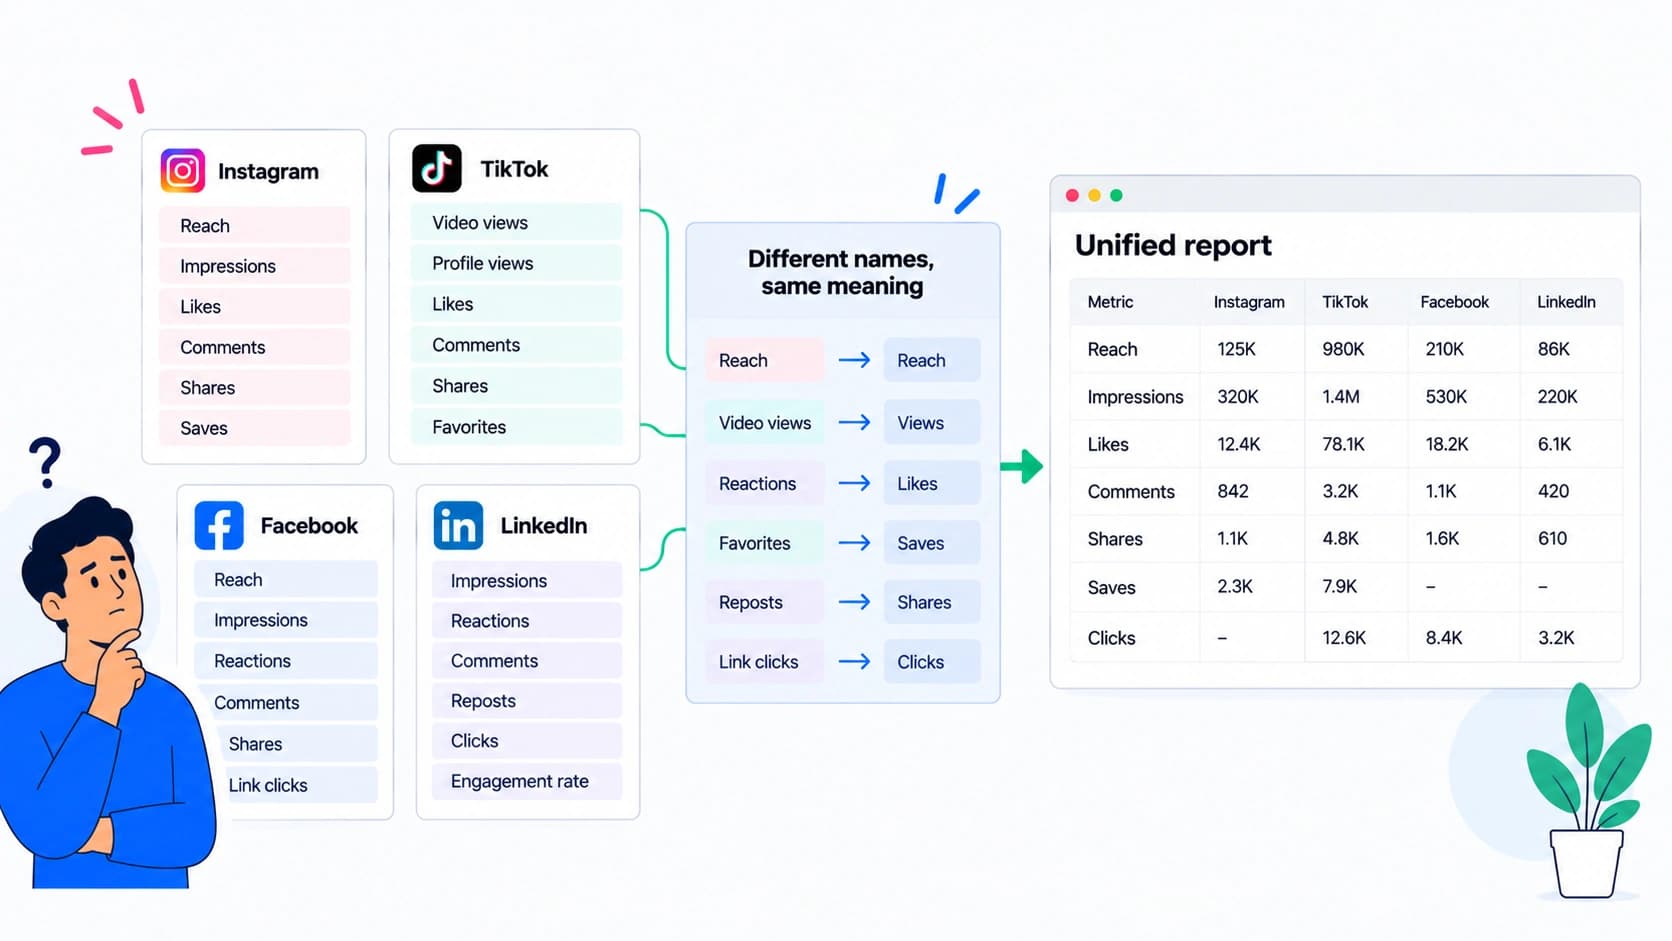
Poststeady never reads engagement rate off a CSV column — LinkedIn's own export includes one, but the app doesn't take it. It's calculated after import, from `engagementRateByPlatform` in `lib/reports/metrics.ts`: `const denom = t.reach || t.imp` — reach first, falling back to impressions only when a platform's file has no reach column at all, and skipping the rate entirely rather than showing a zero when neither is present. Same formula, every platform, every month — so the number on the page can't quietly drift from the two figures printed beside it, and you always know exactly what's behind it when someone asks.
One formula, every platform, every month
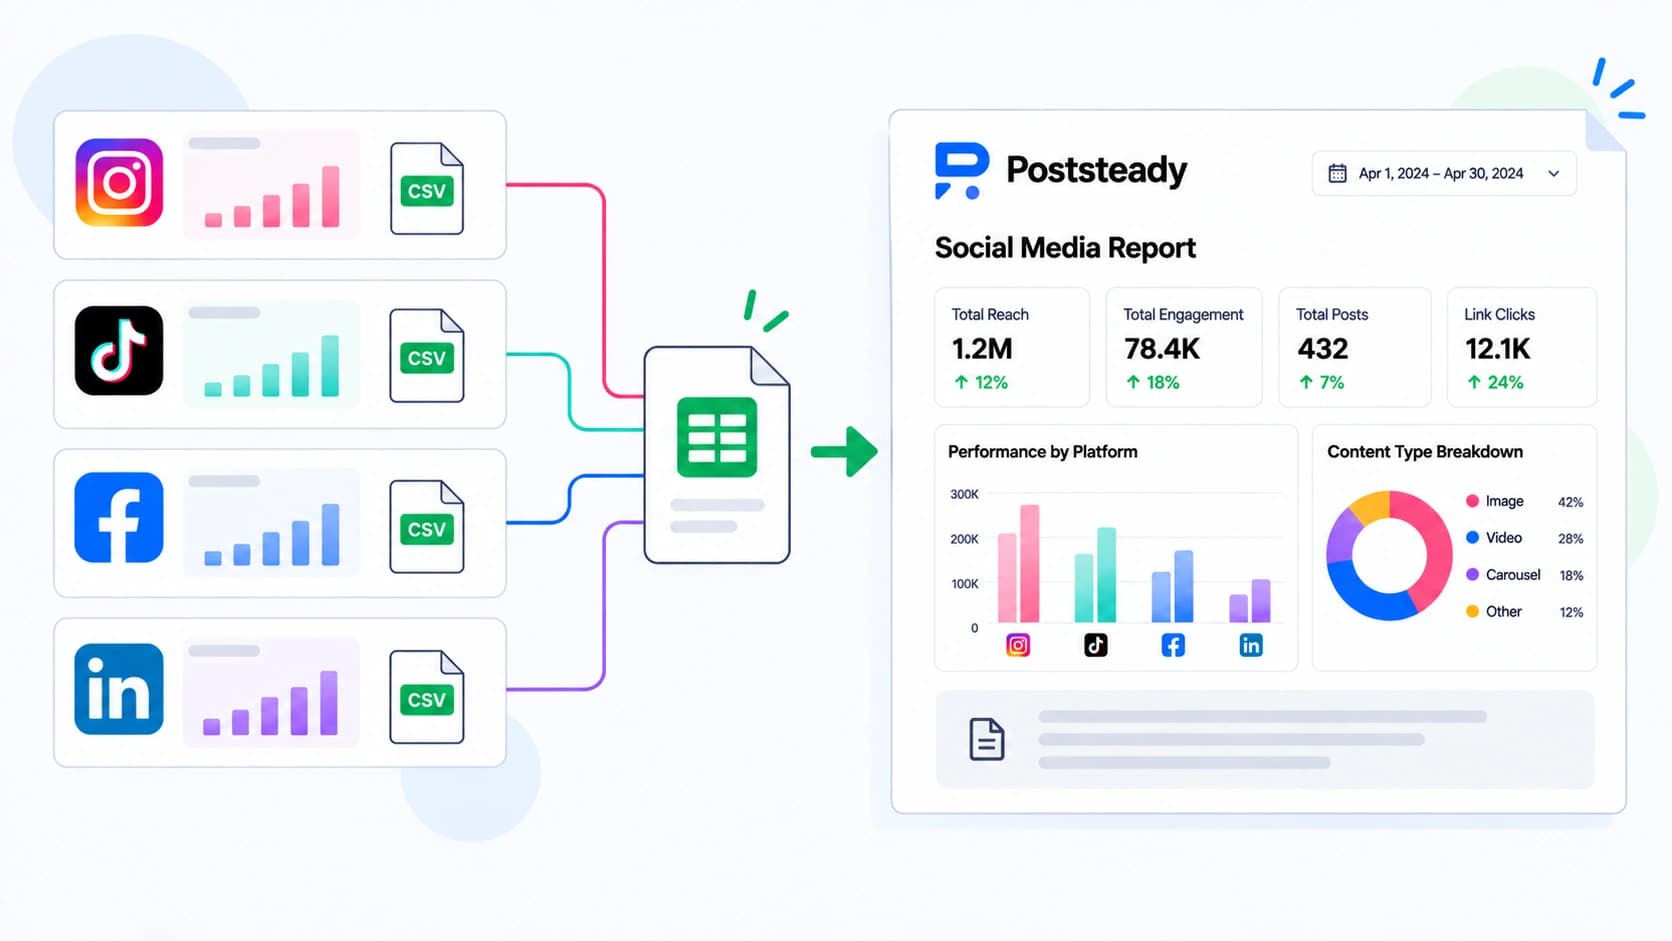
Upload the exports you already download and get an engagement rate that's calculated the same way across the whole report — not copied from whichever column each platform happened to include.