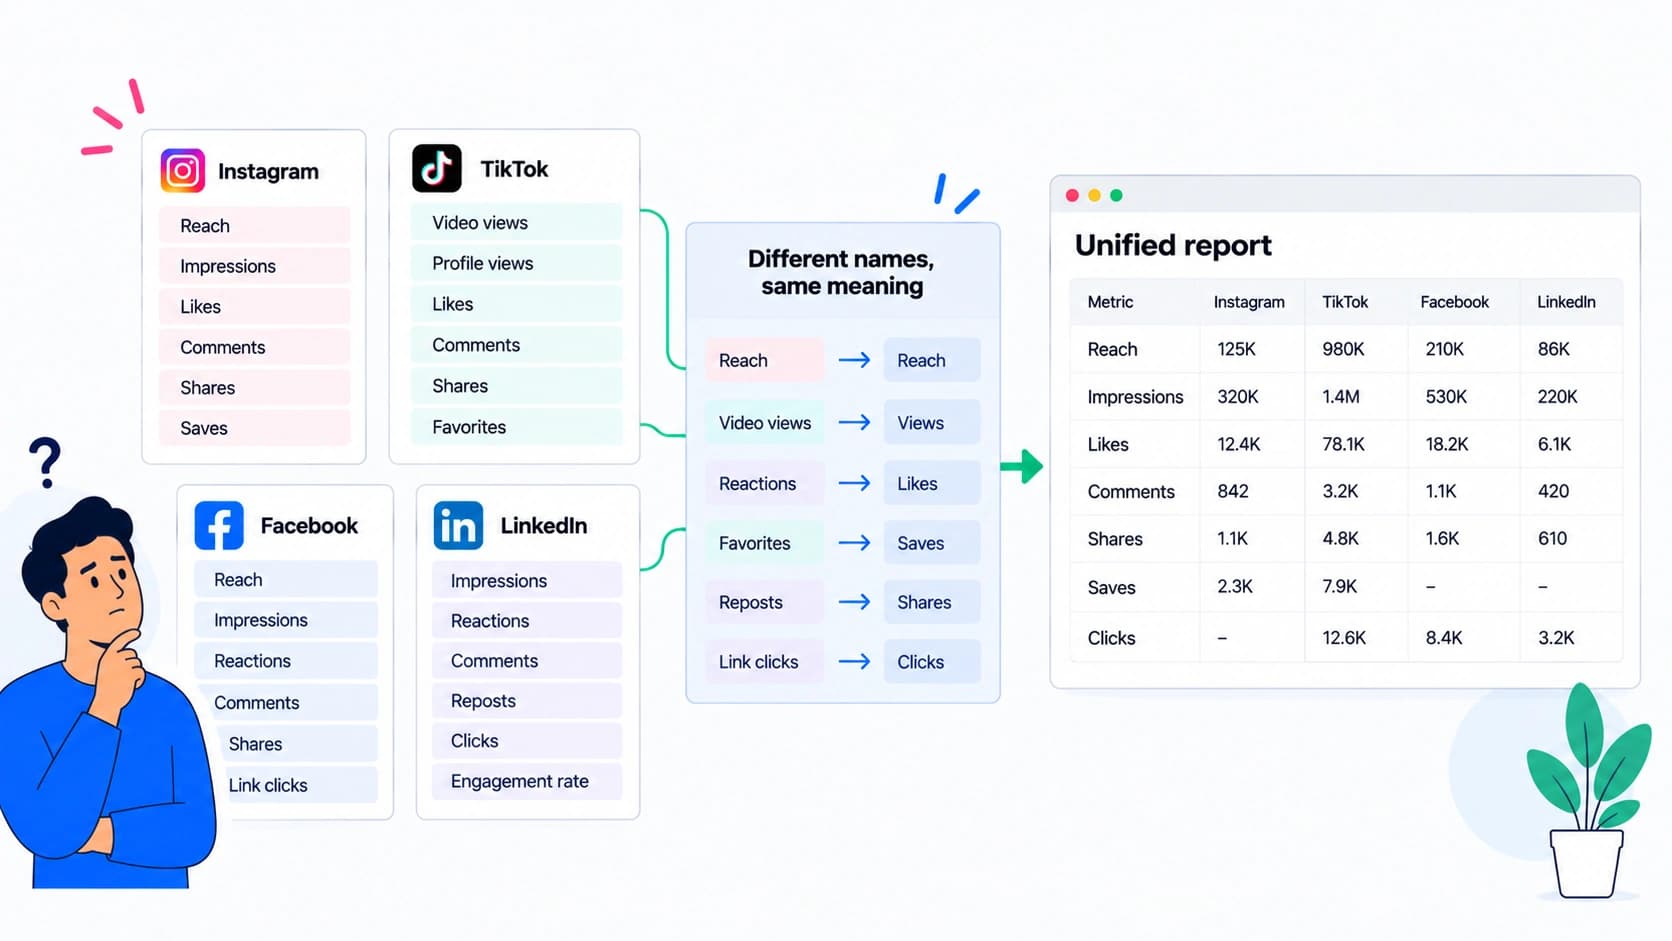

You open a LinkedIn export and a TikTok export side by side to build one report, and neither file has a column called "Reach." One of them has a column that means reach anyway. Guess wrong and you've either dropped the metric from the report or reported the wrong number under the right label.
The same word doesn't mean the same thing
Every platform tracks roughly the same handful of ideas — how many people saw a post, how many times it was shown, how many people did something with it. Almost none of them use the same header for it. Some rename the metric outright. Some keep the name but change what it counts. A client reading three platforms' worth of numbers in one report never sees this; they just see "Reach: 12,400" and assume it means the same thing every time it appears on the page. Your job is making sure it does before it gets there.
Instagram: reach, and impressions is now views
Instagram's Insights call reach "Accounts Reached" — the count of unique accounts that saw the content at least once. That part hasn't moved. What has moved is Impressions: Meta rolled it out of Instagram Insights in favor of a single "Views" metric starting January 2025, and formally deprecated Impressions in the Graph API in April 2025. Views counts every time content displays, repeats from the same viewer included — which is closer to what Impressions used to mean than to Reach, but it isn't literally the same count, and it will read higher than the old Impressions number did for the same post.
Practically: if you're comparing this month's export to one from early last year, "Impressions" and "Views" are not the same column wearing a new hat. Note which one you're reading before you put a month-over-month change next to it.
LinkedIn: "unique impressions" is reach
LinkedIn doesn't put a column labeled "Reach" in front of you at all. In Campaign Manager, the metric that answers "how many distinct people saw this" is called Unique Impressions — the count of unique member accounts with at least one impression, as distinct from total Impressions, which counts every display including repeats from the same person. On the organic Page analytics side, LinkedIn talks about "members reached" rather than reach. Either way, the concept is identical to what Instagram calls Accounts Reached and what Meta calls Reach — LinkedIn just never uses that word.
This one is easy to get backwards, because "impressions" is right there in the label and it's tempting to file it under Impressions instead. Total impressions and unique impressions are two different rows in the same export — mapping the wrong one either understates a strong month or, worse, reports total displays as if it were unique people reached.
Engagement rate: a rate of what?
Engagement rate is the metric most likely to make a client ask why the number in your report doesn't match the number they saw in the platform's own app. The reason is almost never a math error — it's that engagement rate isn't one calculation. Some tools divide engagements by followers, some by reach, some by impressions, and each choice produces a genuinely different number from the same raw activity. A tool that computes engagement rate off impressions will consistently show a lower rate than one dividing by reach, because impressions is always the bigger denominator.
There's no universal right answer here — the fix is naming which one you used, once, in the report, and using the same formula every month so the client's own trend line is at least internally consistent even if it never matches a different tool's number exactly.
What to actually put in the report
- Pick one label per concept and use it everywhere in the report — "Reach" for unique accounts, no matter what the source platform called that column. The client reads one document; they shouldn't need to know LinkedIn's internal terminology to follow it.
- Write down, once, which raw column fed each label — "LinkedIn Reach = Unique Impressions" as a note to yourself, not the client. You'll need it again next month, and in six months you won't remember which of two similarly-named columns you picked.
- Never eyeball-match two platforms' numbers because the columns look similar. "Impressions" on Instagram and "Impressions" on LinkedIn are the same word describing two different counting methods, and only one of your two source files even offers a real reach number natively.
- State the engagement rate formula once if you show it at all. "Engagement rate (of reach)" next to the number costs four words and heads off the one question that comes up most.
How this gets handled without you re-learning it monthly
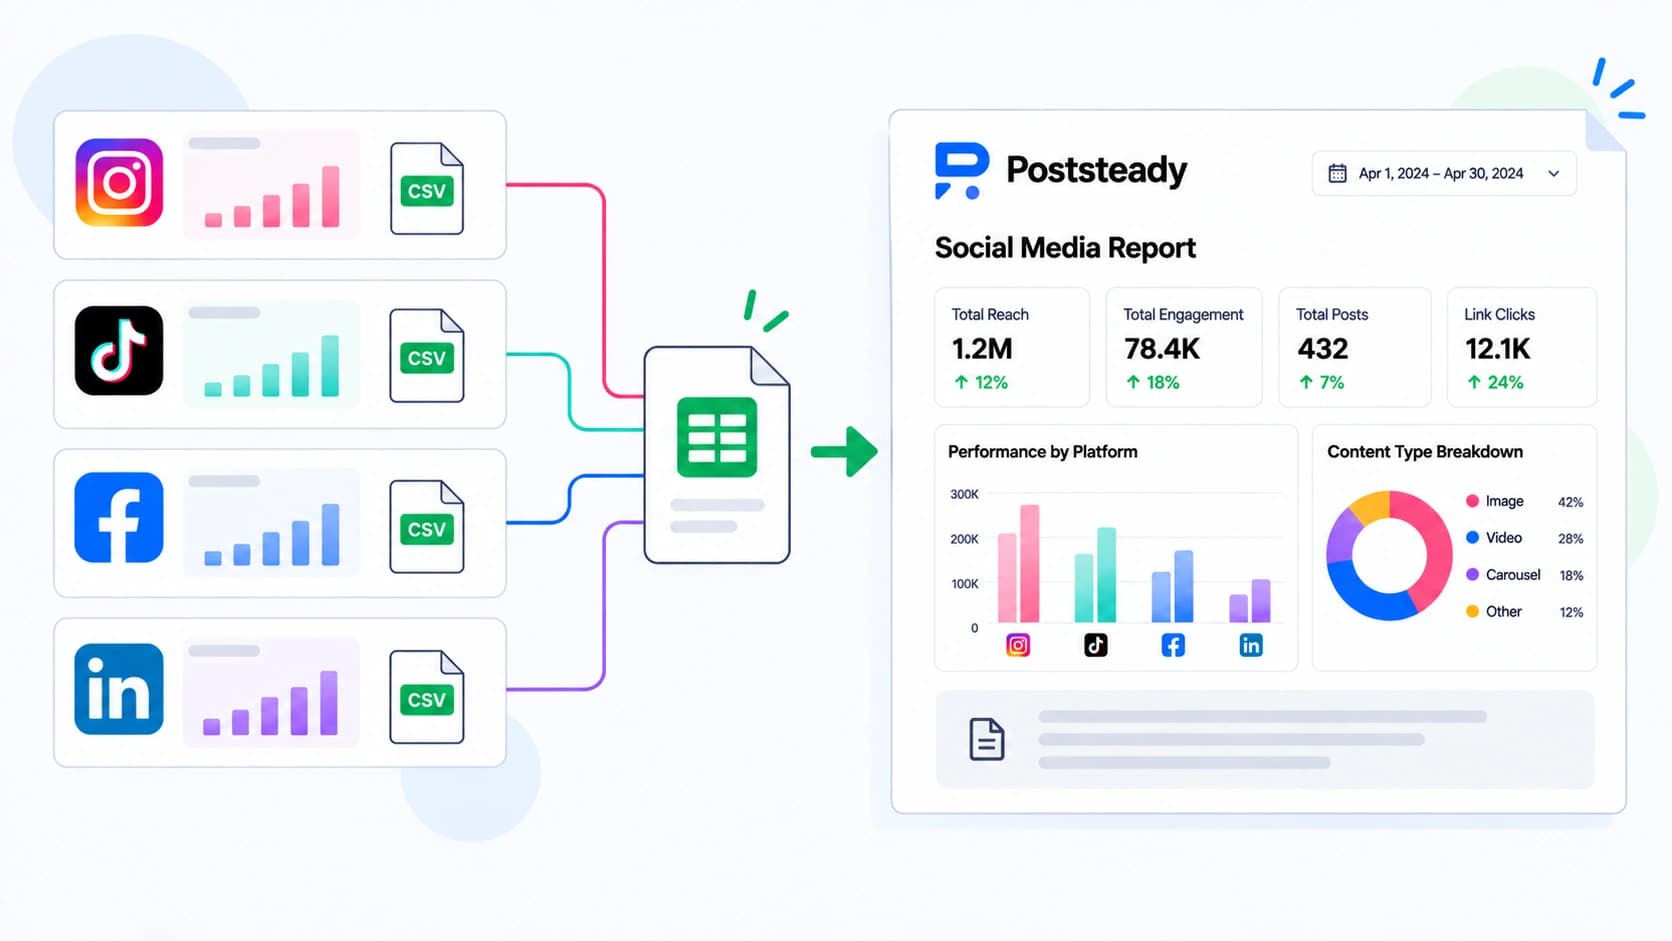
This is the exact problem Poststeady's column mapping exists to solve, and the rules aren't guesses — they're written into the alias list the importer matches CSV headers against. The reach alias includes LinkedIn's own wording directly: `["reach", "total reach", "unique reach", "unique impressions", "unique impressions (total)", ...]`, with the parenthetical variants ordered so LinkedIn's combined "(total)" figure is preferred over its organic-only slice — reporting the organic number alone would understate a month that included sponsored posts.
The impressions alias deliberately leaves out a bare "views" match: `// No "views" alias: a column named plain "Views" is a view count, and YouTube Studio exports one with no impressions column beside it. Letting impressions claim it labelled the client's YouTube views "Impressions."` Same reasoning kept a bare "rate" out of the engagement-rate list — it's a substring of every rate column that exists, and it once claimed a Google Analytics session-key-event rate as the client's engagement rate. And engagement rate is never read from any file in the first place: it's calculated from engagements divided by reach after import, so the number on the page can't disagree with the two figures printed next to it.
You still confirm the mapping on-screen before it's applied — a fingerprint can be wrong, and the tool would rather ask than guess on a shape it hasn't seen before. But the label matching itself, LinkedIn's "unique impressions" to reach, Instagram's "views" to the same bucket "impressions" used to fill, isn't something you have to keep in your head every month.
Stop re-learning each platform's naming every month
Upload the exports you already download and get one report with one set of labels, mapped the same way every time.