
Every guide to these three metrics defines them and stops. Definitions aren't the hard part — you know reach is people and impressions is times shown. The hard part is that you have one page, a client who reads all three as "how many people saw it", and files that don't all contain the same column.
What each number actually answers
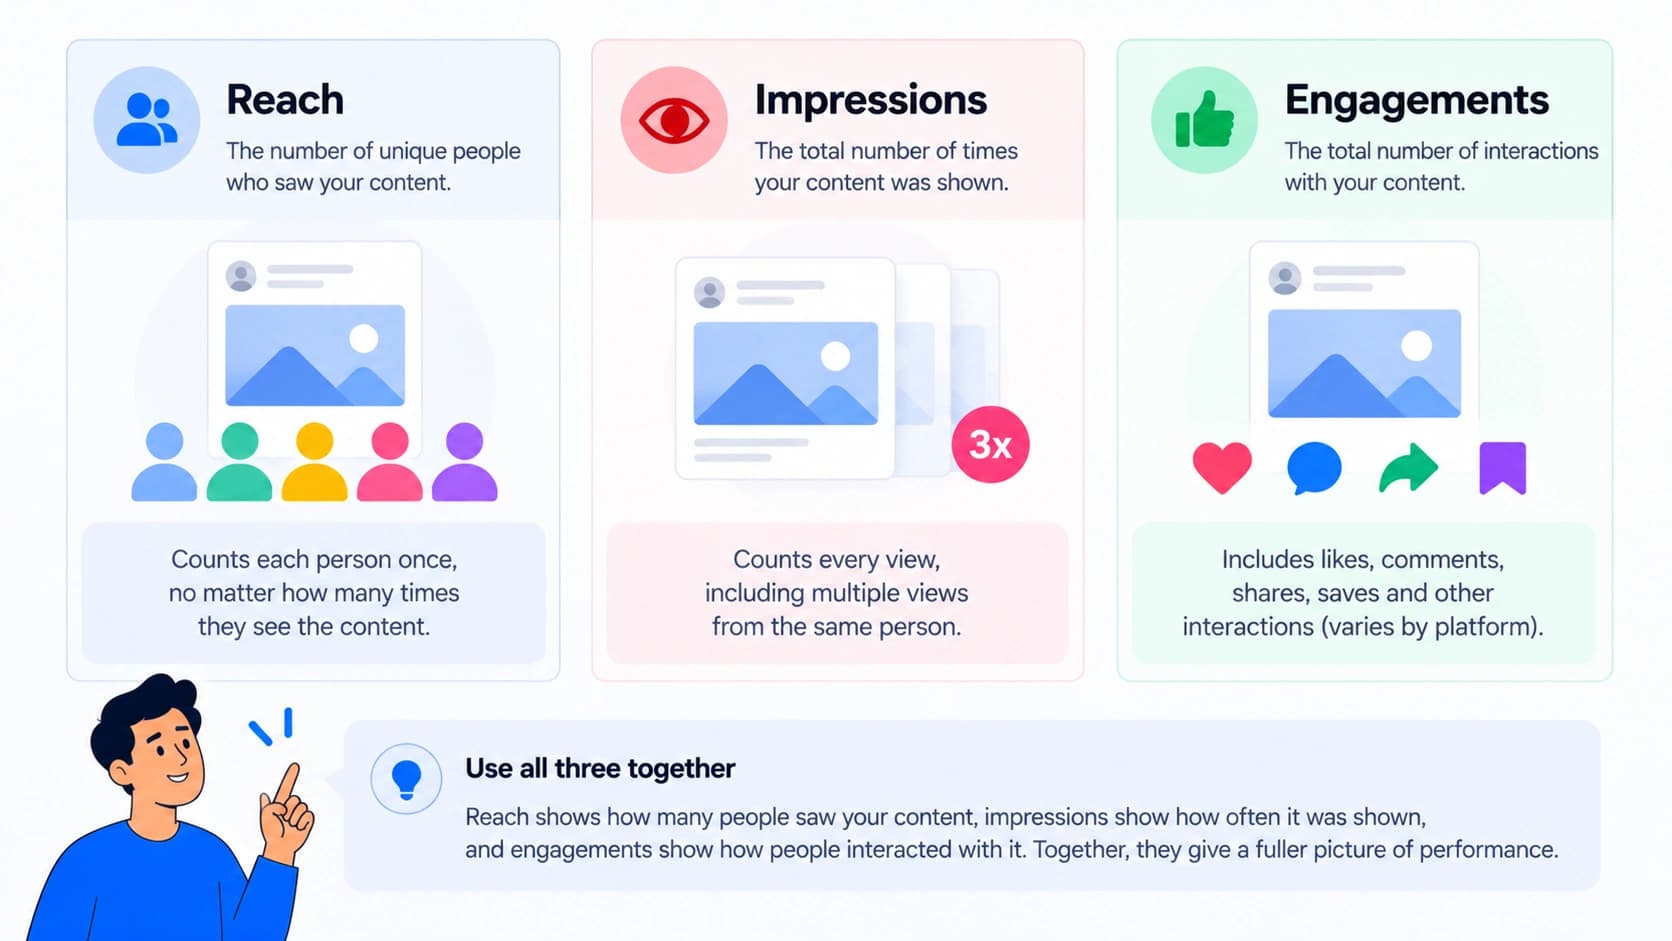
Stop thinking of them as three metrics and start thinking of them as three questions the client is actually asking. Reach answers "how many people did we get in front of." Impressions answers "how often were we in front of them." Engagements answers "how many of them did something about it." That is the whole hierarchy, and it happens to be the order a non-marketer reads them in without being taught.
A number that doesn't answer one of those questions is decoration. That's the test to run before anything goes on page one.
Reach leads, because they can picture it
Lead with reach. It's the only one of the three a client can hold in their head — 12,400 people is a stadium, a mailing list, a number they can compare to their own customer count. Impressions is a delivery count with no human unit attached, which is exactly why it's the one that gets quoted when someone wants a month to look bigger than it was.
That's not a reason to hide impressions. It's a reason not to put it first, where a client will read it as people.
Impressions earn their place as a ratio
Here's the part the standard explainers skip: on its own, impressions is just a bigger version of reach and tells the client nothing new. Its value is what it says when you divide it by reach. That ratio is frequency — impressions divided by reach, the average number of times each person saw you. Meta's ads reporting carries it as its own column for exactly this reason: 10,000 impressions across 5,000 people is a frequency of 2.
Frequency near 1 means you reached a lot of people once and mostly didn't come back to them. Frequency climbing month over month while reach stays flat means you're showing the same audience the same thing more often — a real finding, and usually a strategy conversation. Neither is visible from either number alone. So carry impressions, and write the sentence that only exists because you have both.
Engagements is the number they'll ask about
Engagements is the total of the things people did: likes, comments, shares, saves, clicks, depending on the platform. It's the closest of the three to something a business cares about, and it's also the one where the raw total is least useful alone — 400 engagements means nothing until you know whether it came off 2,000 people or 200,000.
The other trap is that the components aren't equal. A share is a person putting their own name on your client's post. A like is a thumb. If one component moved the total, say which one — a month where engagements were flat overall but shares doubled is a good month, and the total by itself hides that.
The rate, and saying what it's a rate of
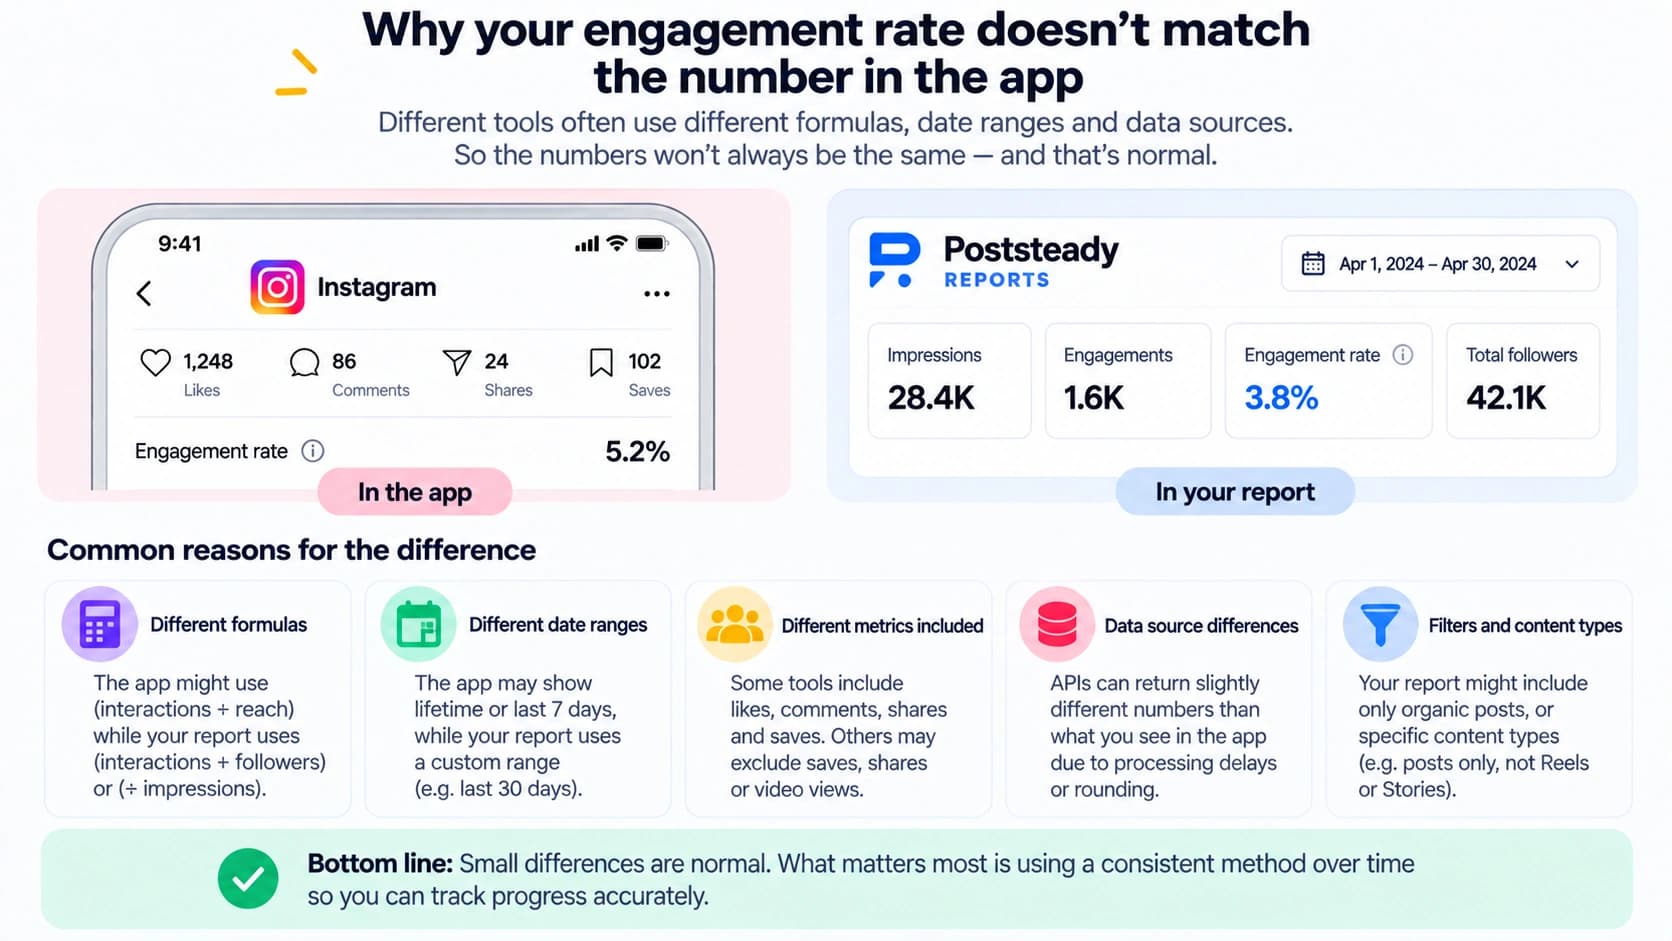
Engagement rate is the fourth number, and it's the one that makes a client ask why your report disagrees with the app on their phone. Usually nothing is wrong: engagement rate isn't one calculation. Divide by followers, by reach, or by impressions and you get three genuinely different numbers off identical raw activity — impressions, being the biggest denominator, always produces the smallest-looking rate.
Pick one, name it on the page, and don't change it mid-relationship. "Engagement rate (of reach)" is four extra words that retire the question permanently. Poststeady doesn't read engagement rate from any CSV column for this reason — it derives the number from engagements and reach after import, falling back to impressions only when the file has no reach in it, so the rate on the page can't contradict the two figures printed beside it.
When the export doesn't give you all three
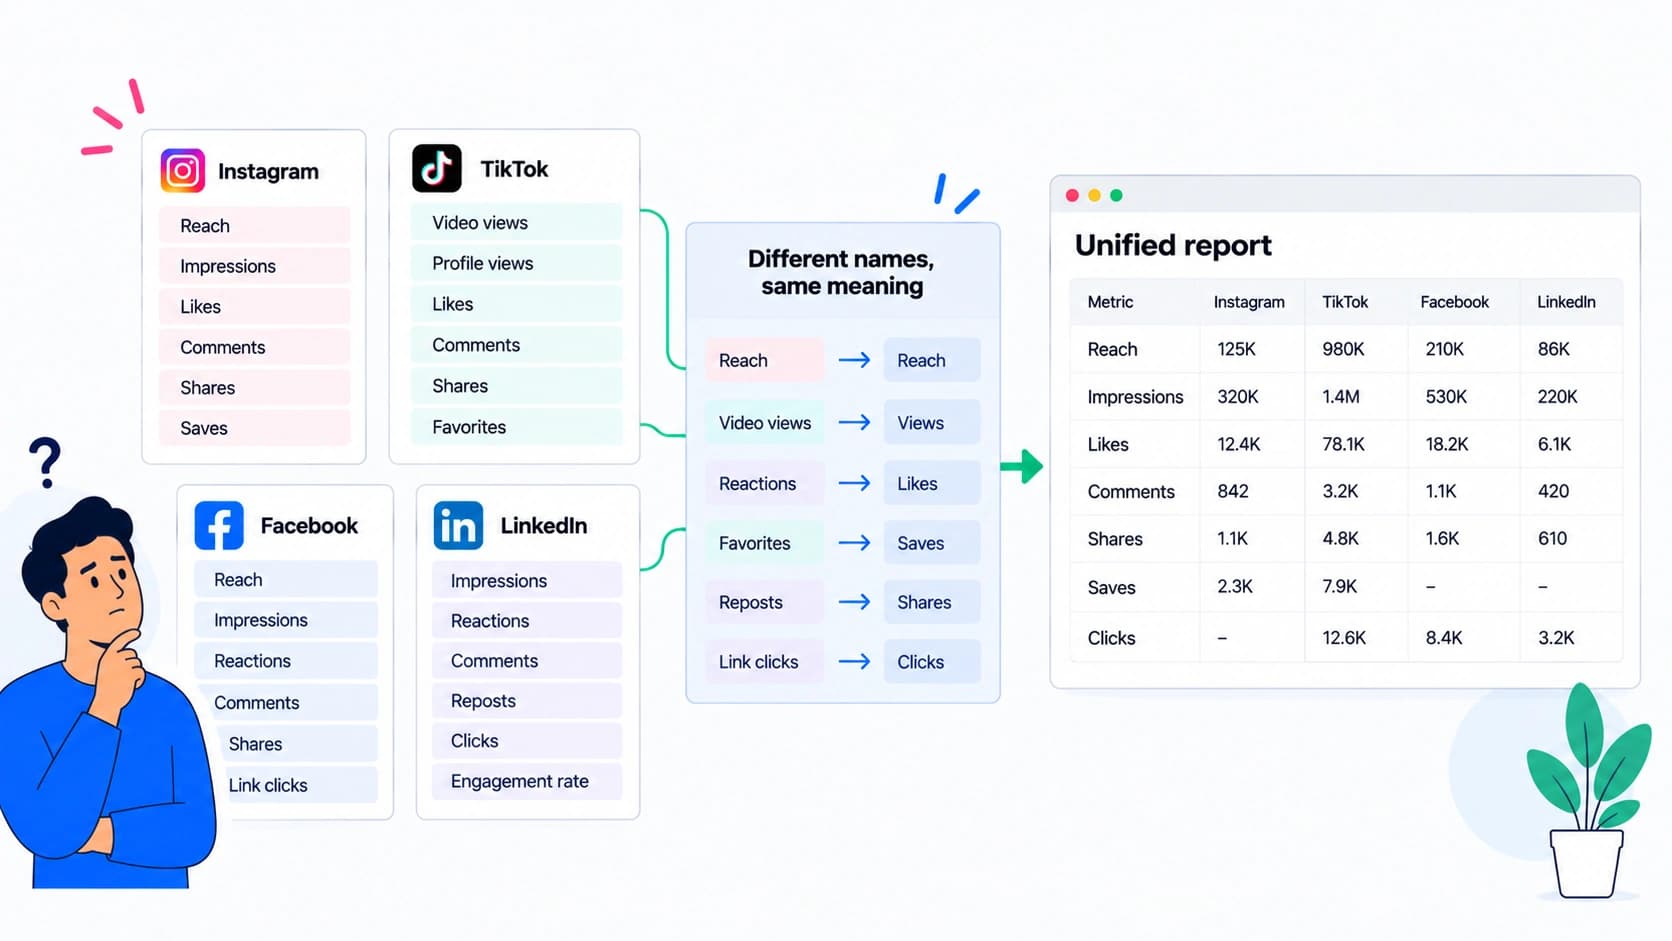
This is where the tidy answer meets real files. Instagram deprecated Impressions in April 2025 in favour of a single Views metric, so a current export and one from early 2024 are not the same column wearing a new label. LinkedIn's Page content export gives you impressions, clicks, reactions and an engagement rate — the unique-people figure is in there under a different name, not under "Reach". TikTok's overview puts video views front and centre and reports reach separately.
So: report the metrics you actually have, on every platform on the page, and never quietly substitute one for another to fill a gap. A blank is honest. Impressions sitting in the reach slot because LinkedIn didn't hand you a reach column is not, and that's the kind of thing that survives eleven months and then gets caught in a renewal meeting.
What this looks like on the page
- Reach at the top, with the month-over-month change next to it. This is the headline.
- Impressions second, plus one sentence on what the reach-to-impressions ratio says this month.
- Engagements third, with the component that moved called out by name.
- Engagement rate last, labelled with its denominator.
- Everything else — saves, profile visits, story views — further down or off the page. Supporting evidence, not headlines.
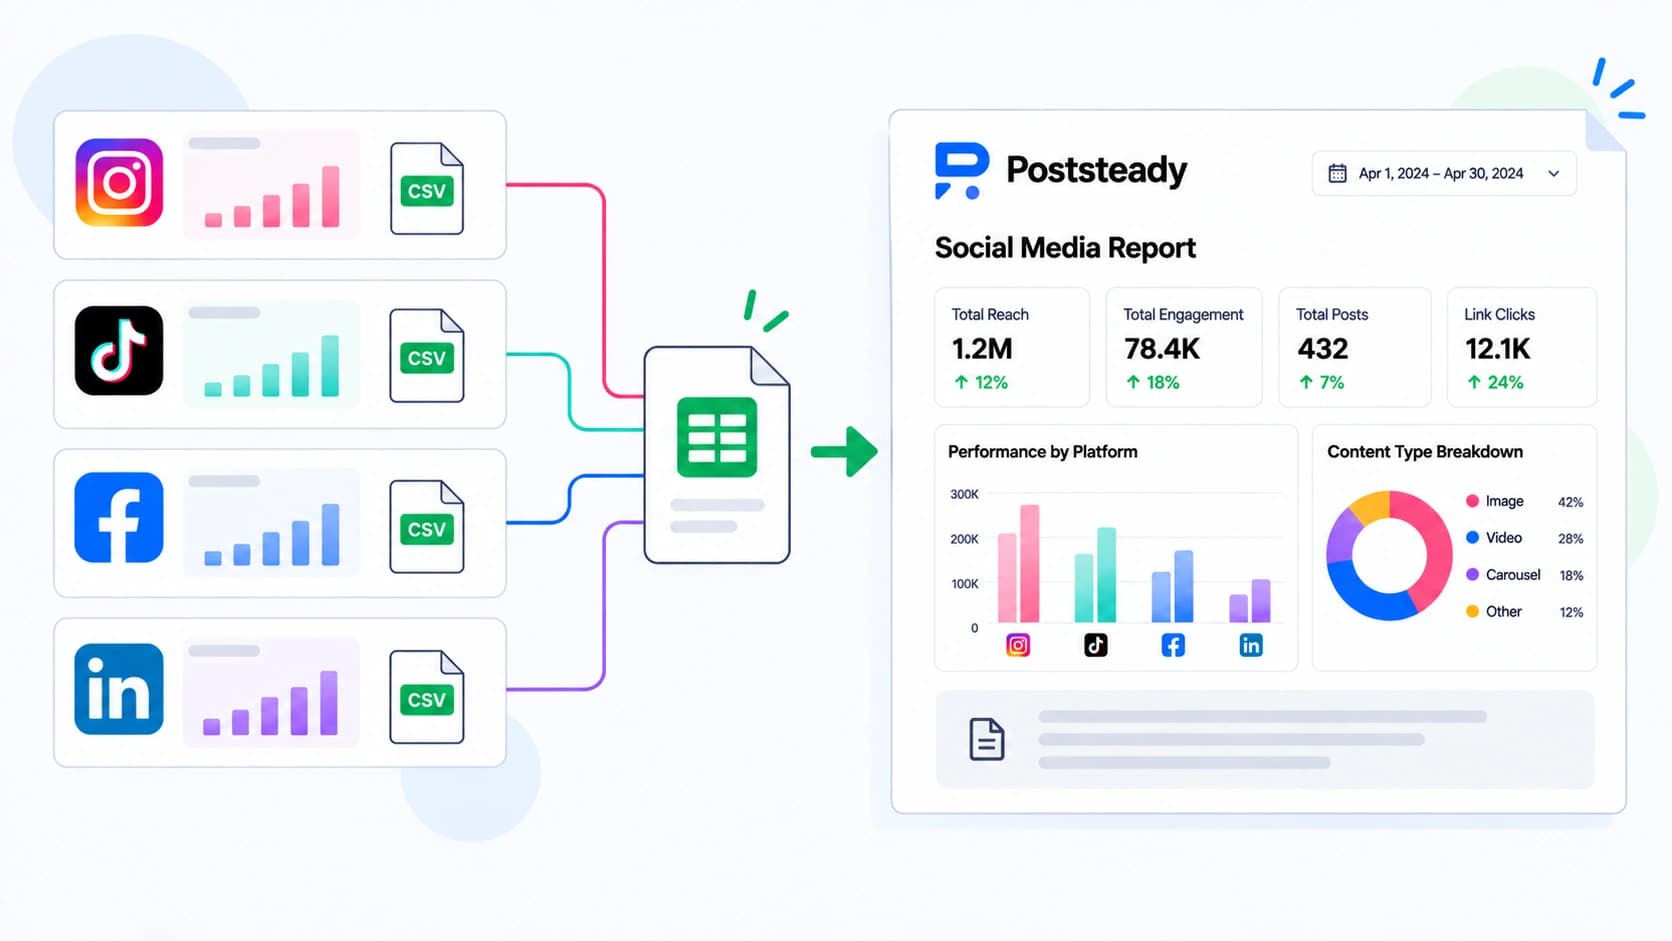
Four numbers in that order with two sentences of interpretation is a page a client reads in one pass. Poststeady builds that band from whatever your uploads actually contain, and any card can be hidden when a platform didn't supply the number — because a missing metric should look missing, not look like a zero.
Put the right four numbers on page one
Upload the exports you already download and get a branded report with reach, impressions, engagements and a rate that agrees with them.