
Naxely, AdReportly, and Poststeady all pitch the same sentence: upload a CSV, get a branded PDF with a written summary, no dashboard or API access needed. That sentence is true of all three, which means it's not the thing that should decide between them. What each tool assumes is inside the CSV is.
The same idea, three ways
"CSV in, branded PDF out" describes a shape, not a specialty. A tool built to summarize any spreadsheet — sales numbers, ops data, whatever — reads a social analytics export differently than a tool built only for social. That difference doesn't show up until you're on the mapping screen looking at what it did with your columns.
Naxely
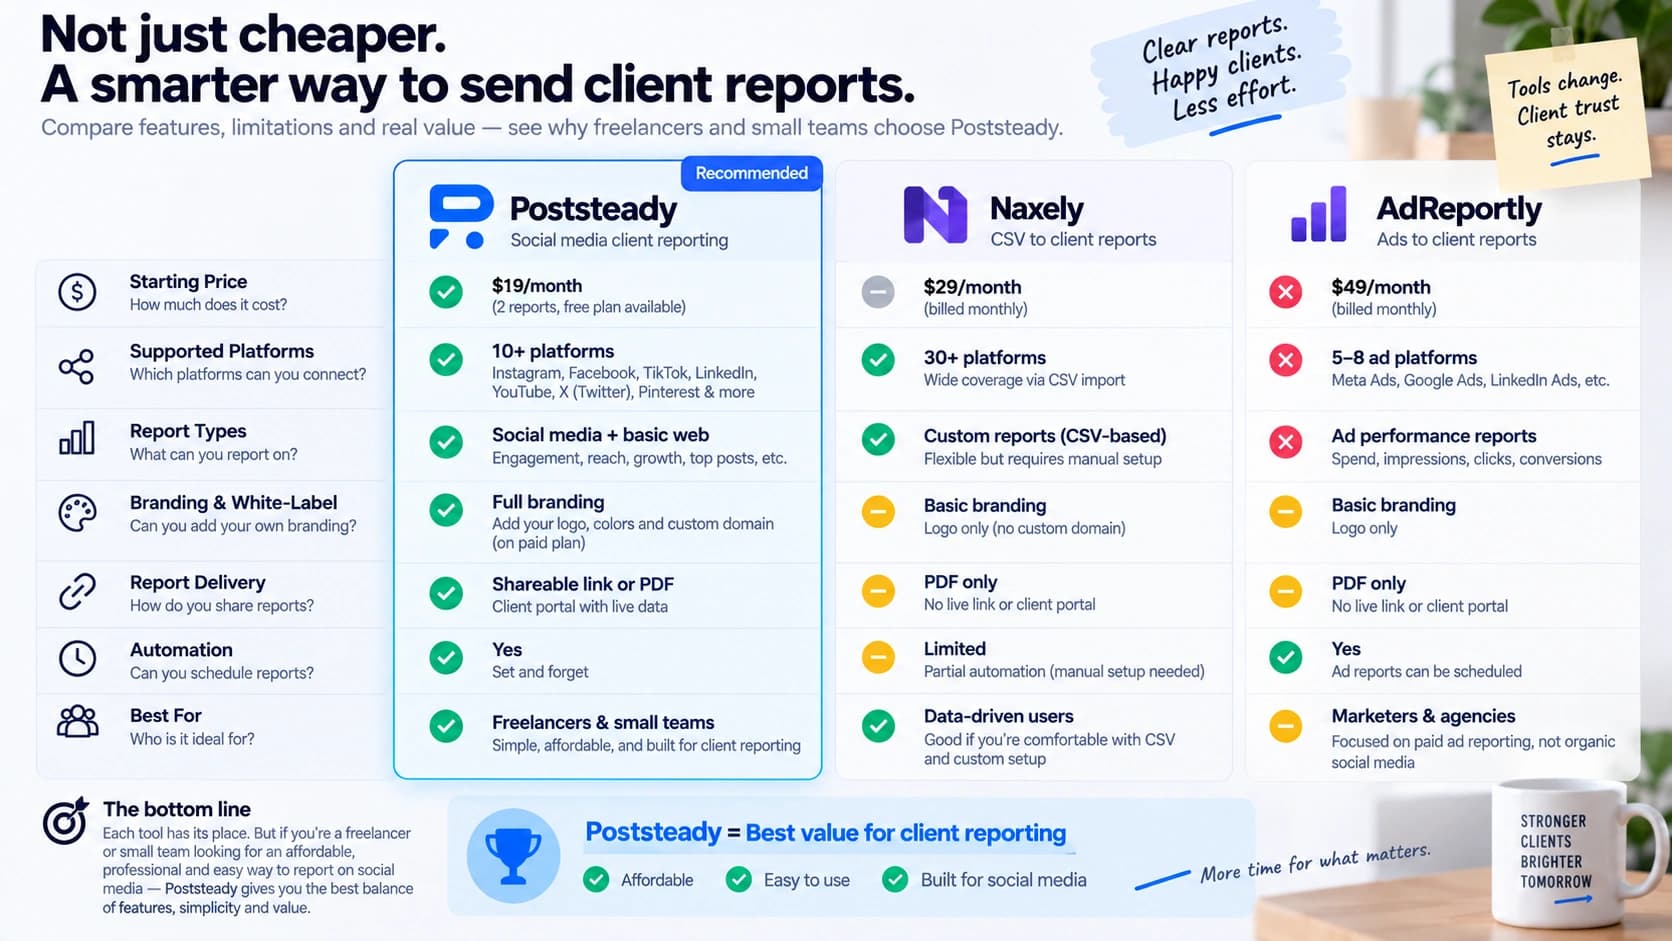
Naxely is a general CSV and Excel report generator, not a social media tool specifically — its own site describes it as handling "client ops, sales numbers, custom KPIs, not just ad platform dashboards." A Google Sheets connection is available from the Pro plan up. The free plan gives 3 reports a month with a watermark on the PDF; Pro is $29/month for unlimited reports, no watermark, and 16 chart types with anomaly detection; Agency is $79/month for PowerPoint export and full white-label. If your reporting spans more than social — a client who also wants their ops numbers or a custom spreadsheet turned into a document — that generality is the point.
AdReportly
AdReportly is built for paid media specifically: Meta Ads, Google Ads, and ecommerce CSV or Excel exports, with column auto-detection and campaign-breakdown rows. It's the closest of the three to a spend-and-conversions report rather than an organic-performance one. The free plan includes 3 reports across all three data types with AI summary and insights. Paid tiers: $5 for a single one-off report with AdReportly's own branding still on it, Freelancer at $19/month for 20 reports with white-label, and Agency at $39/month for unlimited reports with full white-label. If a client's report is mostly ad spend and ROAS, this is the narrowest, cheapest-at-volume fit of the three.
Poststeady
Poststeady sits in between: built specifically for social media, both organic and paid, not general business data and not ad platforms alone. `detectSource()` in `lib/reports/auto-map.ts` fingerprints the file itself rather than asking you to pick a data type first — it tells Meta Ads Manager apart from Meta Business Suite by whether "Amount Spent" or "Post reach" is in the header row, and separately recognizes Google Ads, LinkedIn Campaign Manager, TikTok Ads Manager, and third-party social analytics tools like Buffer or Sprout by their own column combinations. `ALIAS_MAP` behind that carries the aliases for every metric it knows, built from research across those same real platform exports.
Free plan: 2 reports a month, forever, full features, no watermark. Pro is $19/month for unlimited reports. Client branding — logo, brand color — is saved per client and applied automatically on both plans.
What each one recognizes in your file
This is the practical test: drop in the same Meta Business Suite export on all three. A general tool like Naxely will chart whatever columns it finds — it doesn't know that "Post reach" specifically means a Meta metric worth comparing against last month's Meta number, because it isn't built to know that. AdReportly is built for ad accounts, so an organic Business Suite export (no spend column) is outside what it's designed to read cleanly. Poststeady's mapping is scoped to exactly this: `METRIC_DEFS` in `lib/reports/metrics.ts` lists the social metrics it stores a column for — reach, impressions, engagements, followers, and on through 21 metrics plus 6 calculated rates — and nothing outside that set gets invented a place to live.
Which one fits your client
- Reporting spans more than social — ops numbers, a custom spreadsheet, sales data: Naxely's generality is built for exactly that, and its free tier covers a light month.
- The report is mostly ad spend, ROAS, and conversions across Meta and Google Ads: AdReportly is narrower and cheaper at volume for that specific data.
- The report is social performance — organic, paid, or both — and the CSV comes from the platform's own export: Poststeady's mapping is built around exactly that column set.
- Not sure which describes your next report: it's worth trying the one built for the data you actually have rather than the one with the most chart types.
See what your social export maps to
Upload the CSV you already have and see it recognized, mapped, and turned into a report — two a month, free.