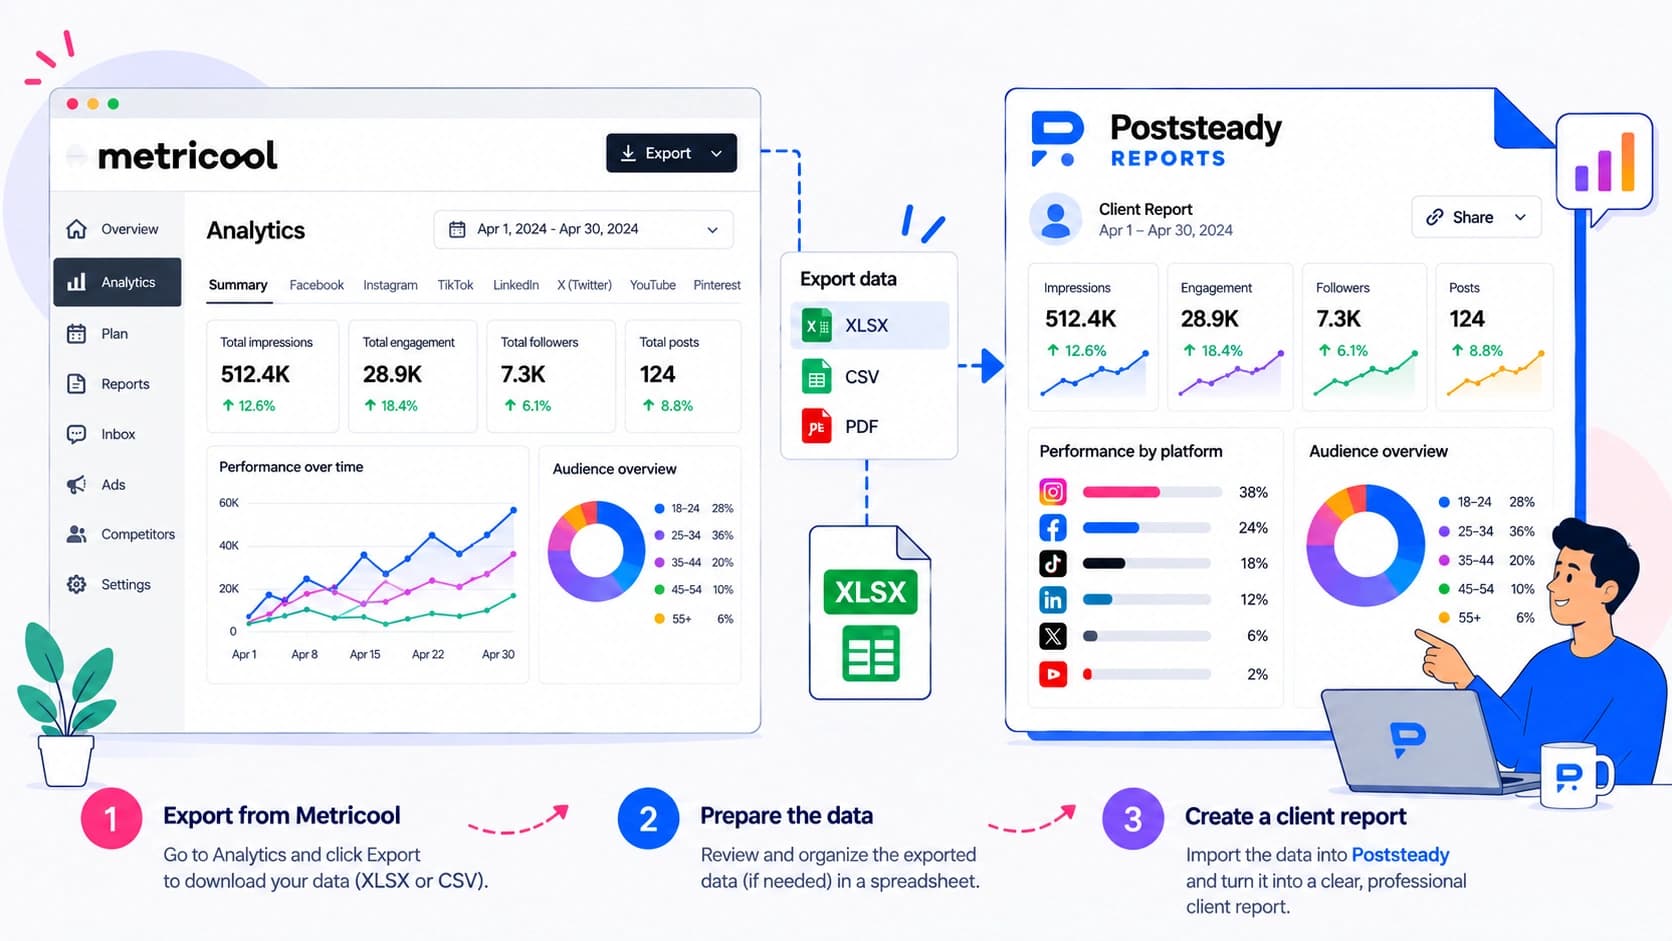

Metricool already builds a client report for you — a branded PDF or PPT, pulled straight from the numbers it tracks. So the useful question isn't "how do I export Metricool data", it's "why would I bother, when the report is already built?" There's a real answer, and it only applies to some reports.
Metricool's report vs. the CSV
Metricool's free plan lets you view analytics inside the platform, watermarked, with no export option at all. Paid plans unlock the CSV download on the Analytics tab, and separately, Starter plans and up unlock the report builder — a proper branded PDF or PPT with your logo and brand colors, one-off or scheduled to email itself monthly. If your client's whole footprint lives inside Metricool's connected networks, that built-in report is the faster path. There's no reason to route around it.
When you actually need the CSV
The CSV earns its place the moment the client's report needs something Metricool's own template doesn't carry. Two situations come up constantly: the client also runs paid ads (Meta Ads Manager, Google Ads, TikTok Ads Manager) that Metricool's organic report doesn't fold in, or you're already assembling reports from three or four different tools and Metricool's own PDF format is one more format you'd have to reconcile against the rest by hand. In both cases, pulling the numbers out as data — rather than as a finished document — is what lets you build one report instead of stapling several together.
What trips people up in the file
- Metricool's analytics are broken out per network, not per report — Instagram, Facebook, LinkedIn, TikTok and the rest each have their own metric set (Instagram's Reels section alone has watch time, retention, and view rate that Posts don't). Exporting network by network means the file you get is scoped to one channel; a report covering three networks is three exports, not one.
- Metricool labels the same idea differently depending on where you're looking. The dashboard calls the raw engagement number "Interactions" on the Account tab, which is the same thing most other tools just call engagements — worth knowing before you build a client-facing sheet that mixes Metricool's wording with another platform's.
- "Saved" is its own column, separate from likes, comments, and shares — don't fold it into a generic "engagement" total unless the client's other platforms are counted the same way, or the month-over-month comparison stops meaning anything.
Turning the export into your own report
Once you've got Metricool's CSV next to a paid-media export or another platform's file, the report is the part that actually takes the evening: matching up column names, redrawing charts, writing something the client will read past page one.
Poststeady's column mapping was built against real exports rather than a spec sheet, so "Interactions" lines up with engagements without you retyping it — the alias list in `lib/reports/auto-map.ts` maps `engagements` from `["engagements", "total engagements", "post engagements", "interactions", ...]`, so a Metricool column named exactly "Interactions" is claimed on the first pass. "Reach", "Followers", "Likes", "Comments", and "Shares" match the same way. "Saved" doesn't have a match in the current alias list for saves (`["saves", "total saves", "bookmarks", "save actions"]`) — Poststeady flags it rather than guessing, and you pick it from the dropdown once. That mapping gets saved as a preset, so next month's Metricool export lines up without the manual step repeating.
Turn that export into a client report
Upload the CSV you just downloaded and get a branded three-page report, with the summary written for you to edit.