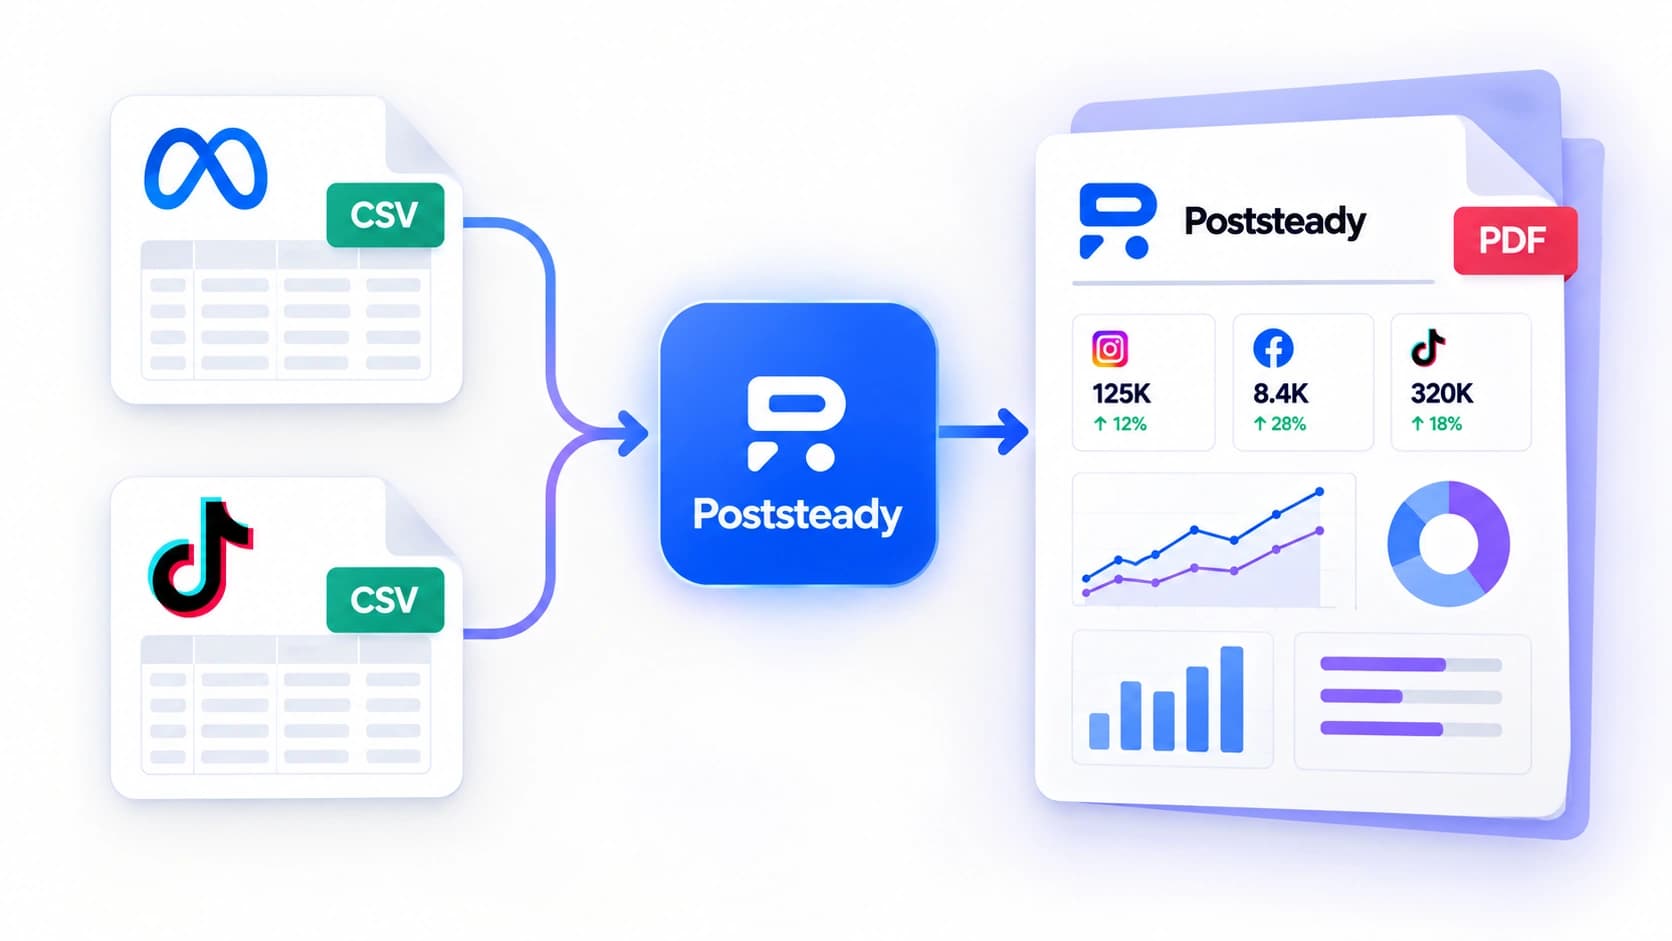

You've got two files: a Meta export and a TikTok export, both for the same client, both for the same month. You need one PDF with your logo on it, and you need it today. Searching this mostly turns up dashboard tools that want you to connect an account first, or spreadsheet templates that leave the branding and the writing to you. Here's the actual short path from two CSVs to a finished report.
Why this is harder than it sounds
Meta and TikTok don't agree on much. A Meta Business Suite export ('Post reach', 'Accounts reached') and a TikTok export don't share column names, don't share a reporting-period format, and don't share a definition of a view. Combining them by hand means renaming columns to match, lining up date ranges, and then building something presentable — three separate jobs before you've written a word about what happened.
The slow way: slides or a spreadsheet
The default move is a slide deck: paste screenshots or numbers from each platform onto its own slide, add your logo, write a summary underneath. It works, but it's manual every single month — the same copy-paste-format loop for every client you report to. A spreadsheet template is faster to fill in but isn't something you hand a client; it still needs a pass to make it look like a deliverable, not a data dump.
The fast way: upload, map, export
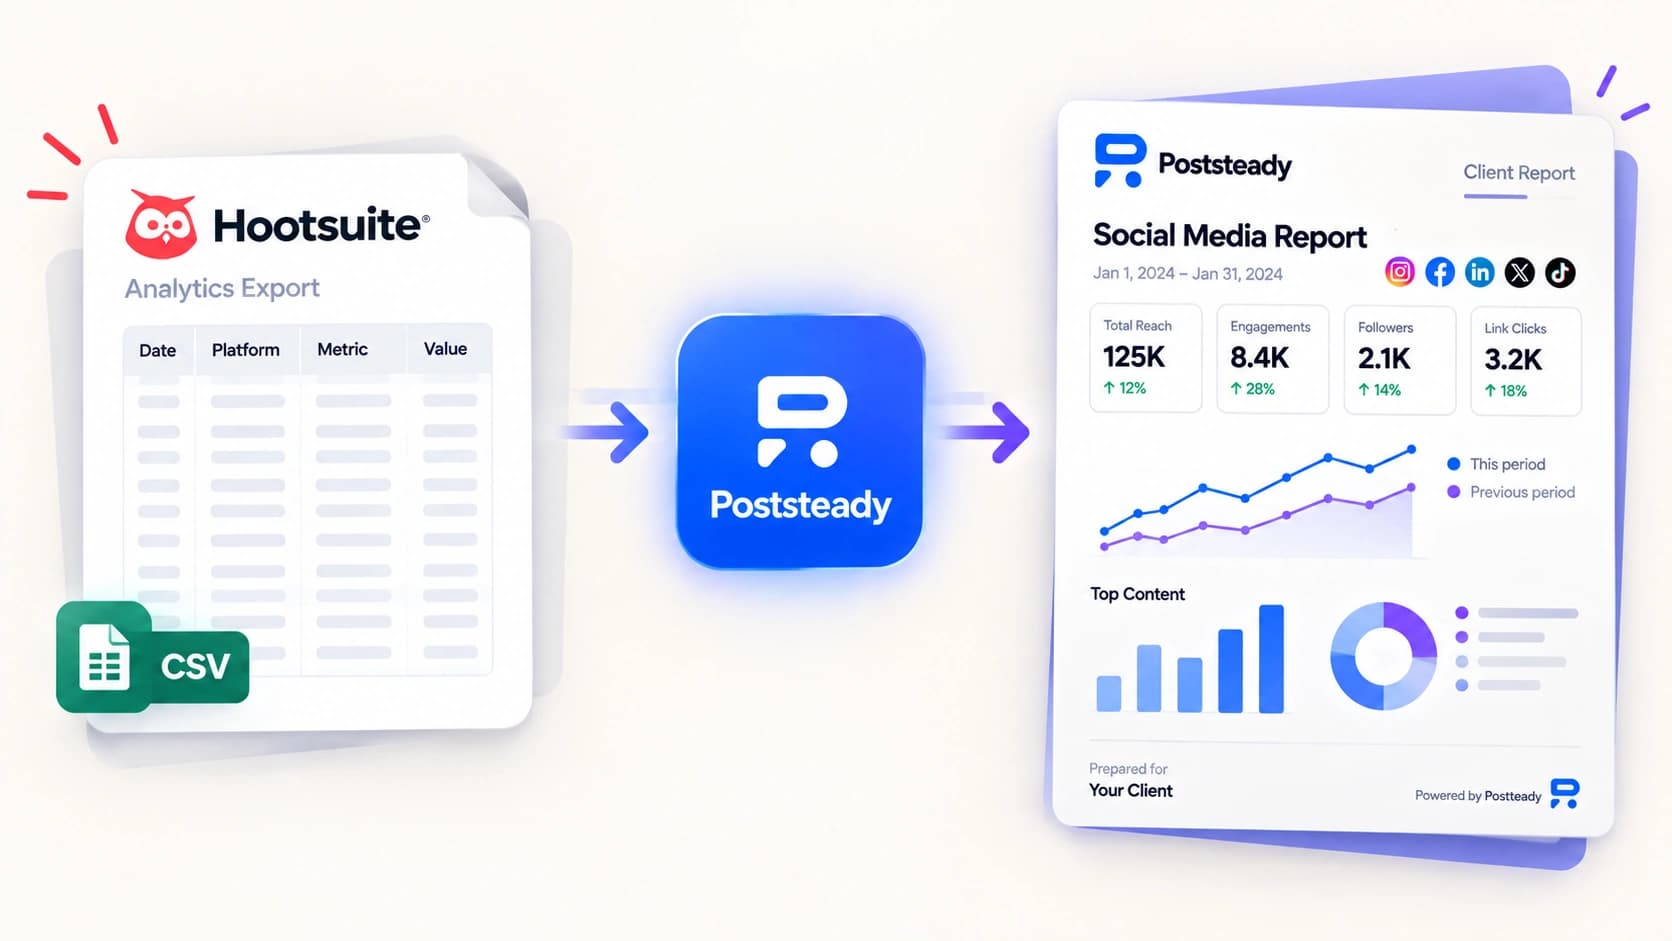
Poststeady skips both. Drag in the Meta export and the TikTok export, confirm the column mapping (it's mostly done for you — more on that below), and it produces a three-page PDF: an executive summary with KPI cards, a platform-by-platform breakdown so Meta and TikTok stay visibly separate rather than blurred into one number, and a written recommendations page. Your logo and brand color come from the client record, so a report you set up once looks right every month after.
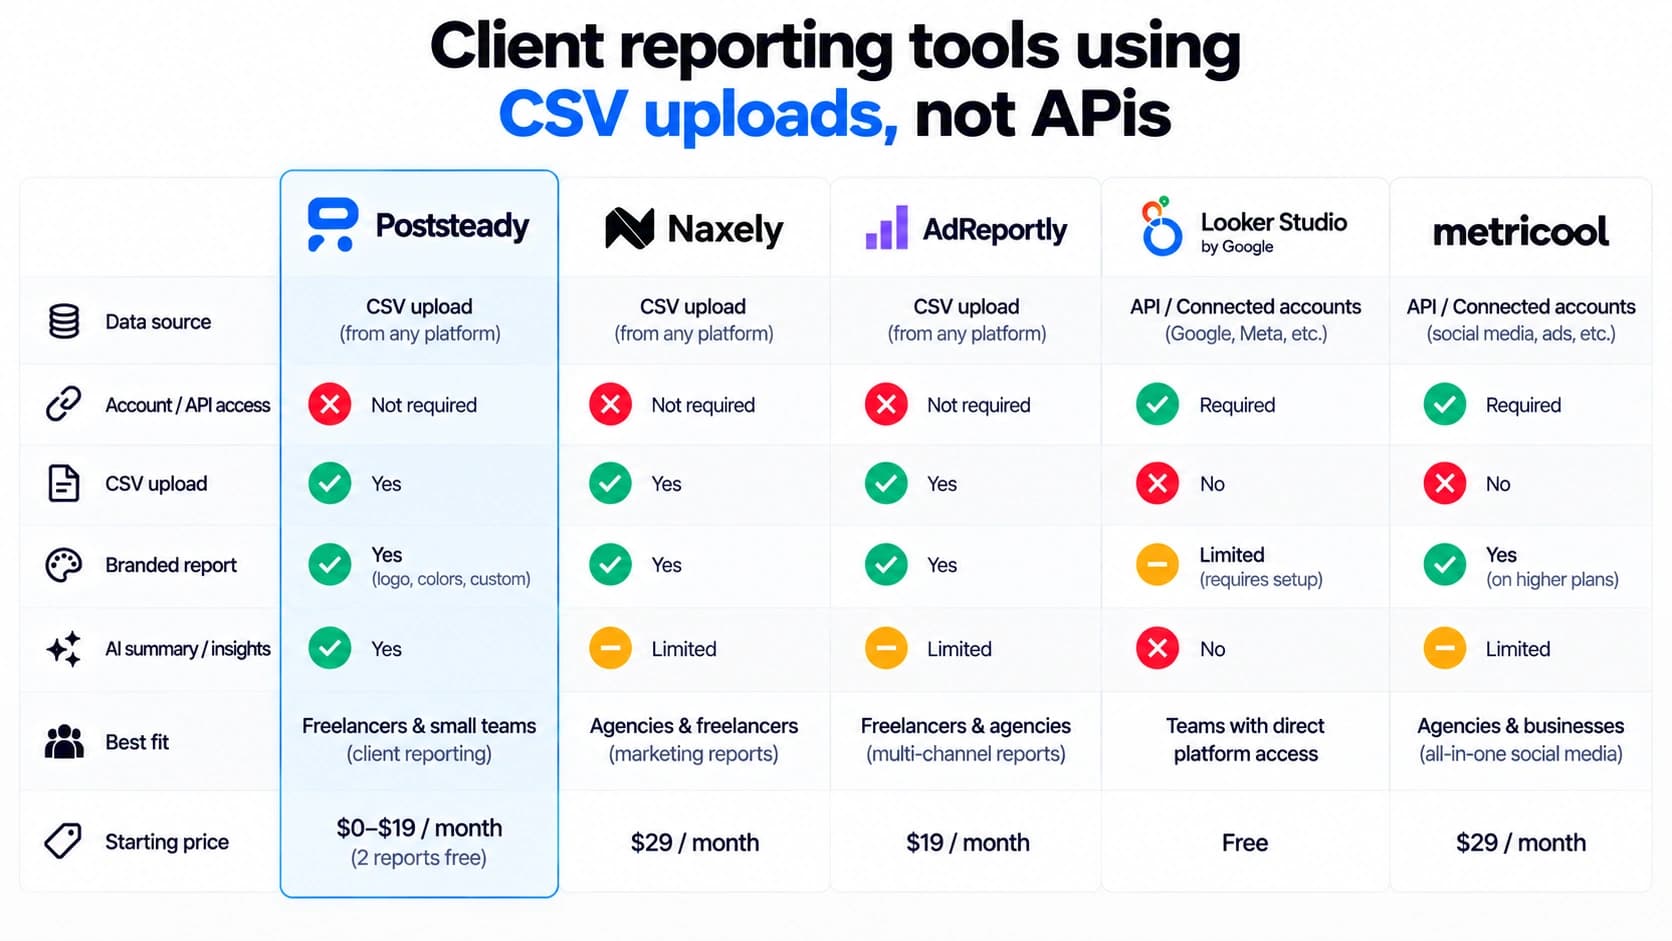
Nothing here connects to your client's Meta or TikTok account. You're uploading files you already downloaded — there's no permission request to send, and no API to break when a platform changes its terms.
- Export the two CSVs from Meta Business Suite and TikTok, same client, same date range.
- Pick the client and reporting period in Poststeady — this is what everything else gets checked against.
- Drag both files in. Each one gets fingerprinted and grouped under its own platform automatically.
- Confirm the column mapping on one screen — most rows are already filled in.
- Review the numbers, edit anything that needs a correction, and toggle off metrics this client doesn't care about.
- Export the PDF, or send a share link that opens with no login required.
What actually happens to your two files
On upload, Poststeady fingerprints each file by its column headers rather than its filename. A Meta Business Suite export is recognized by columns like "Post reach" or "Accounts reached"; a TikTok Ads Manager export by "Video views" next to a "Cost" column. An organic TikTok analytics export — the kind without ad spend — doesn't get its own dedicated fingerprint; it's read as a generic social analytics export (engagement rate plus followers columns are the signal) and you confirm the platform on a dropdown, which takes one click.
From there it maps each column against roughly 175 known header aliases across 21 stored metrics, so "Amount Spent" in one file and "Cost" in the other both land on the same metric instead of becoming two different numbers in your report. Anything it can't confidently match gets flagged for you to assign by hand, rather than silently guessed at. Confirm the mapping once and it saves as a preset, so next month's pair of exports lines up automatically.
The two platforms don't get merged into one blended figure — page two of the report keeps Meta and TikTok as separate rows, because averaging them together would hide which one actually moved the month. Rates like engagement rate are calculated from the totals rather than pulled from either file, so they can't drift from the numbers printed next to them.
The one thing to get right before you upload
Re-export both files to the exact same date range before you touch anything else. Meta and TikTok don't default to the same window — one export can quietly cover a rolling 30 days while the other covers the calendar month — and nothing in either file flags that they're not the same period. A platform-by-platform report will still print two clean-looking numbers if the ranges don't match, it just won't be comparing the same month twice. Fix it at the export step, before it becomes a number someone has to explain to a client.
This matters more with two platforms than one, because a mismatch doesn't throw an error — it just quietly overstates whichever platform's window happens to be longer. Poststeady's importer only ever writes rows that fall inside the reporting period you picked in step one; anything outside it is excluded rather than silently summed in, and the wizard tells you how many rows that was so a short TikTok export or a stray extra week in the Meta file doesn't slip through unnoticed.
Next month, with the same two platforms
The mapping work isn't a monthly tax. Once you've confirmed how a Meta Business Suite column and a TikTok column map to your metrics, that mapping saves as a preset tied to the client and the source. Next month's pair of exports — same two platforms, new numbers — lines up on the first screen instead of asking you to redo the work. Where it can trip up is two files from the same platform in one upload (say, a TikTok organic export and a TikTok ads export together); each source only keeps one saved preset, so the second file of a matching type falls back to auto-mapping instead of the saved preset. It still maps, just not from the shortcut.
Try it with this month's exports
Upload your Meta and TikTok CSVs and get a branded three-page PDF. Free for two reports a month.