
Later's help docs tell you where the Export CSV button is. What they don't tell you is what you're actually holding once you've clicked it — which is not "my client's Later analytics" in one file. It's a specific slice of one section of one platform, over one date range, and a monthly client report usually needs five or six of them.
One export per section, not per client
The export lives on the section, not on the dashboard. You open the analytics tab you want, set the date range for that section, and hit Export CSV there. Do it again for the next section. There is no "download everything" button, and there's no reason to expect one — each section is a different chart with a different shape.
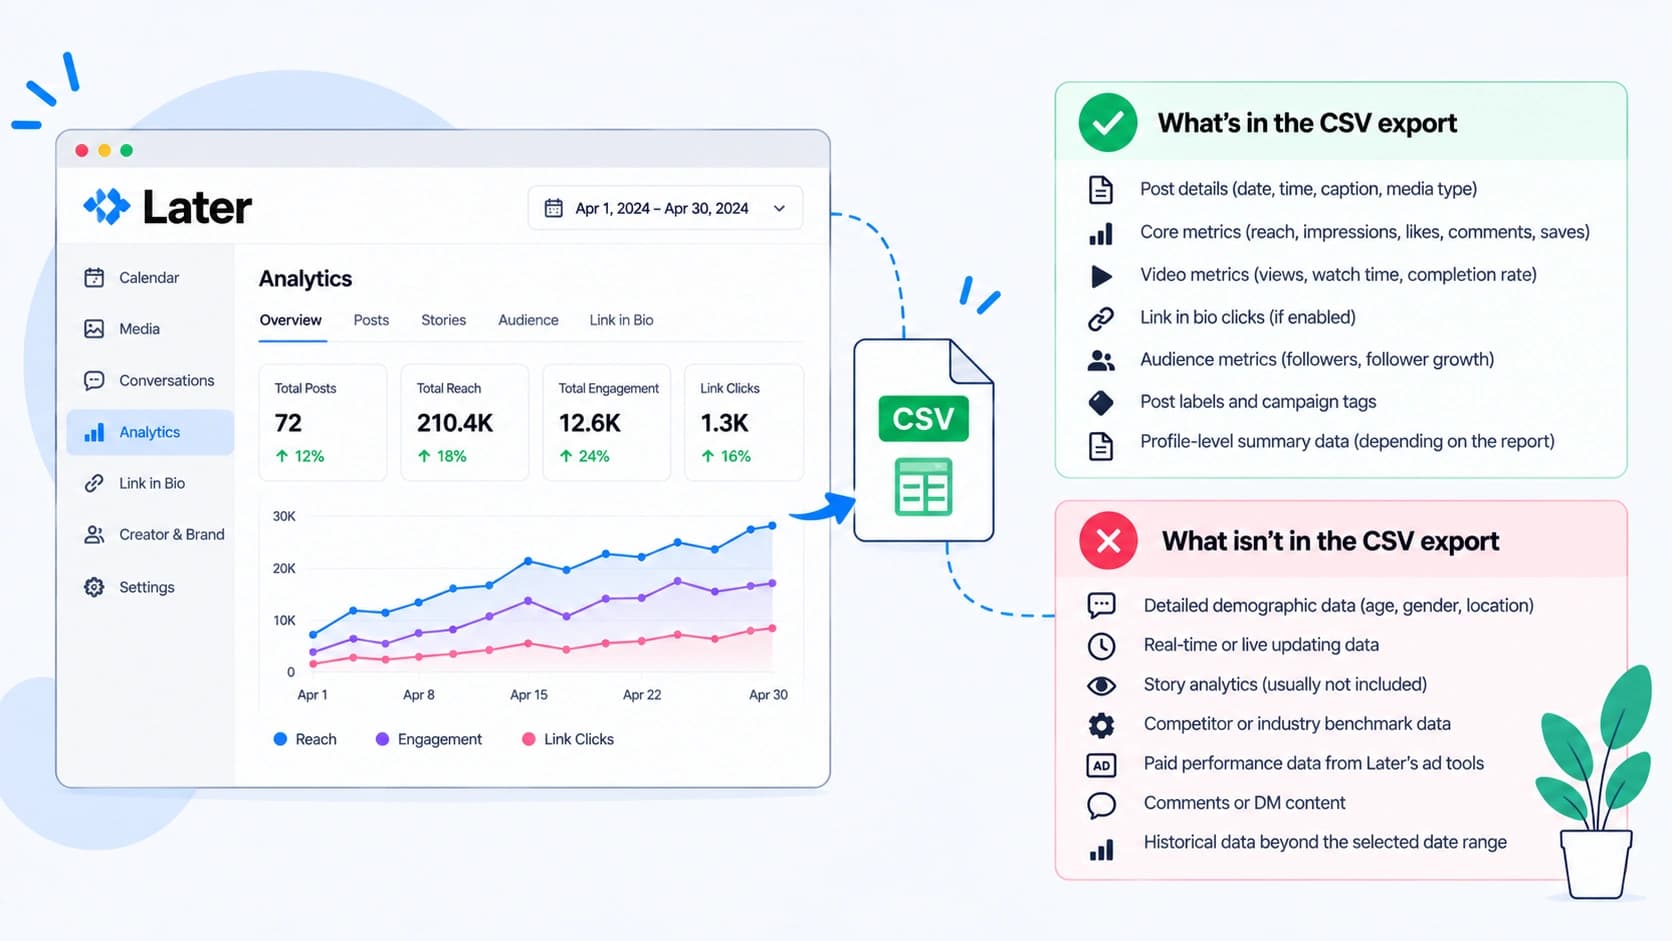
For Instagram, the sections you can pull are Profile Growth & Discovery Metrics, Profile Interactions, Audience Engagement, Audience Demographics, and Audience Location and Language, plus post-level tables like Detailed Post Performance, Story Performance and Hashtag Performance. That last group is gated: Reel, Story and Hashtag analytics need Growth or Scale. The plain dashboard CSV export itself is on Starter, Growth and Scale.
Other platforms have their own buttons in their own places. LinkedIn's export sits on the Post Performance and Video Performance tables — top-right of the table, same Export CSV — and it needs Growth or above. So a client running Instagram and LinkedIn is already two tabs, two date ranges, two downloads, before you've opened a spreadsheet.
Two different shapes of file
This is the part that catches people, and it decides which files are useful to you at all. The sections split into two kinds:
- Time-series sections — Profile Growth & Discovery, post and story performance. These come out as rows over time, one row per day or per post, with the metric columns beside them. This is the shape a monthly report wants: it sums, it compares to last month, it draws a chart.
- Audience snapshot sections — Demographics, Location and Language, Audience Engagement. These are a picture of who your followers are right now, or when they're online. There's no month in them to compare against. Exporting March and exporting April gives you two snapshots, not a trend, and nothing you can add together.
Both are worth having. They just do different jobs. The snapshot files are context you write a sentence about — "the audience skewed younger this quarter" — and the time-series files are the numbers that go in the table. If you're picking which exports to bother with on report day, take the time-series ones first and pull a demographics snapshot quarterly rather than monthly.
The metrics Meta took away
If you've been reporting on Later for a couple of years, your template probably has rows the file can no longer fill. Meta's API changes removed a stack of them, and Later removed them in turn: Impressions, Profile Interactions (Profile Views and Website Clicks), Total Video Views, Top Languages, Initial Plays and Total Plays are all gone from Instagram Analytics. Facebook lost Page Likes and Impressions the same way.
This isn't a Later problem and switching tools won't fix it. The number stopped existing upstream. Every tool reading the same API lost the same columns on the same day.
The practical consequence: if last year's report for this client had an Impressions row, you can't fill it from this year's export, and you shouldn't quietly swap Views into the same row and let the client read it as continuous. Rename the row, say once in the summary that the metric changed at the source, and move on. Clients take that fine. What they don't take well is a number that halves with no explanation.
How far back the file goes
Your plan sets the window, and the window is on the data, not just the view. Starter reaches back 3 months, Growth 1 year, Scale 2 years. If you're on Starter and you want a year-over-year comparison in December, that comparison had to be exported back in the spring — it isn't sitting there waiting.
Worth doing once: export each active client's full available history the day you set them up, and keep the files. Storage is free, and re-downloading history you no longer have access to is not a thing you can do. Scheduled report deliveries and Custom Analytics exports sit on Scale, so on Starter and Growth this is a manual habit or it doesn't happen.
Turning the pile of files into one report
So report day looks like this: four or five CSVs in a downloads folder, two of them snapshots you'll only quote in a sentence, the rest daily rows with slightly different column names than last month's Meta Ads export. Then the actual work — matching columns, adding up, redrawing charts, writing something worth reading.
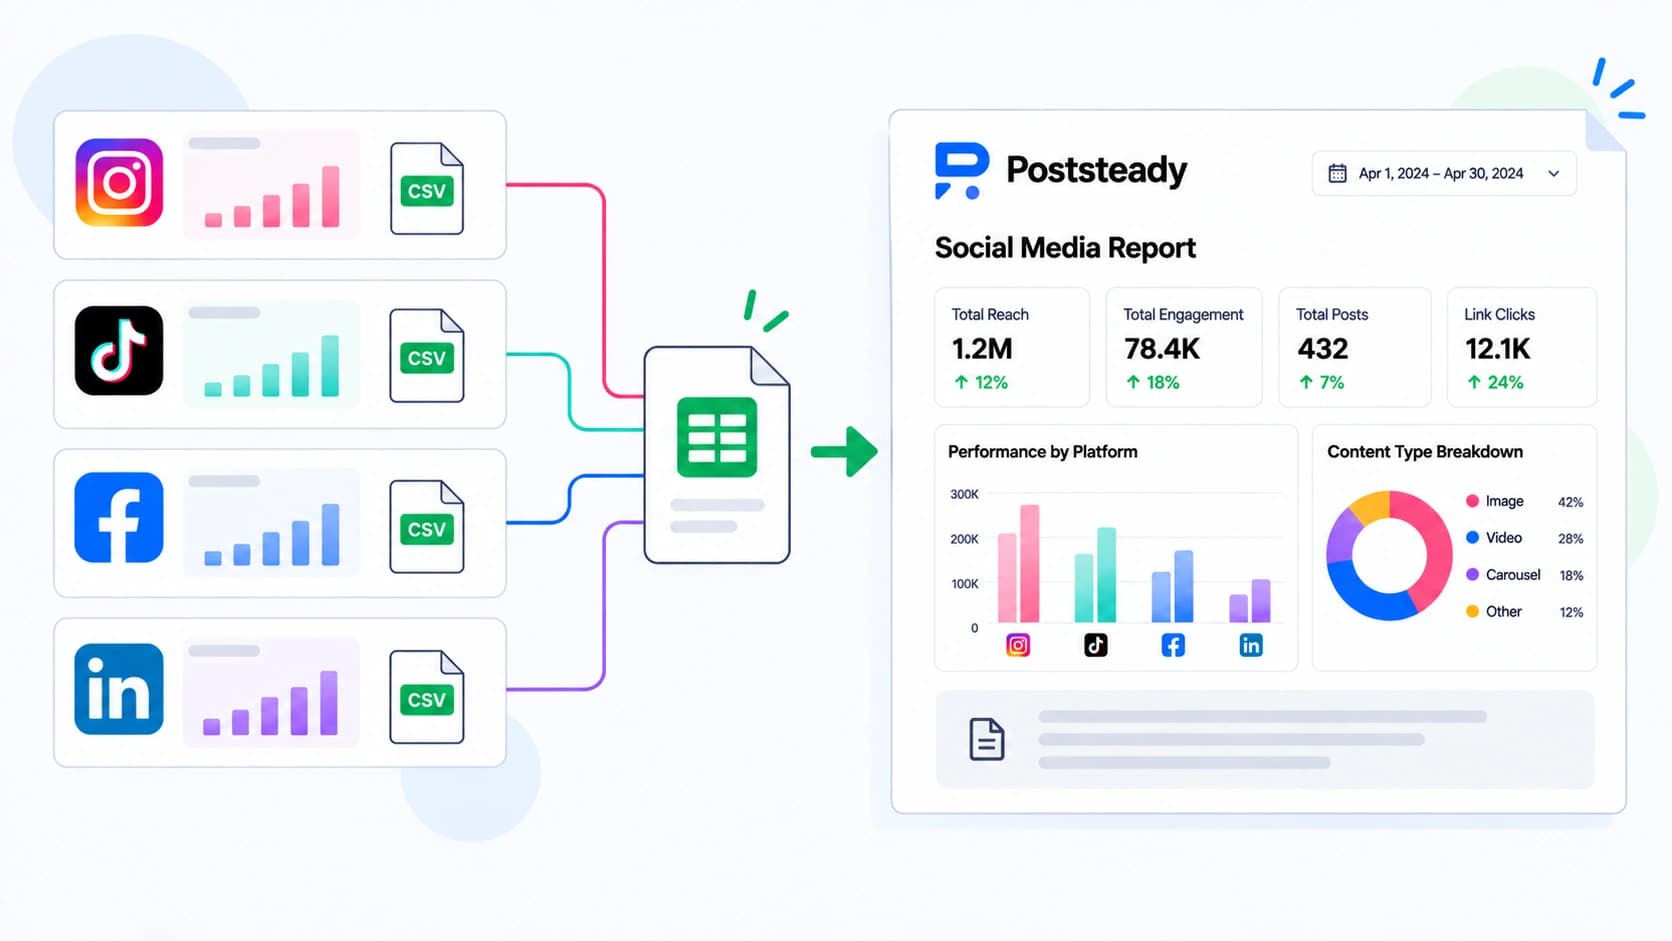
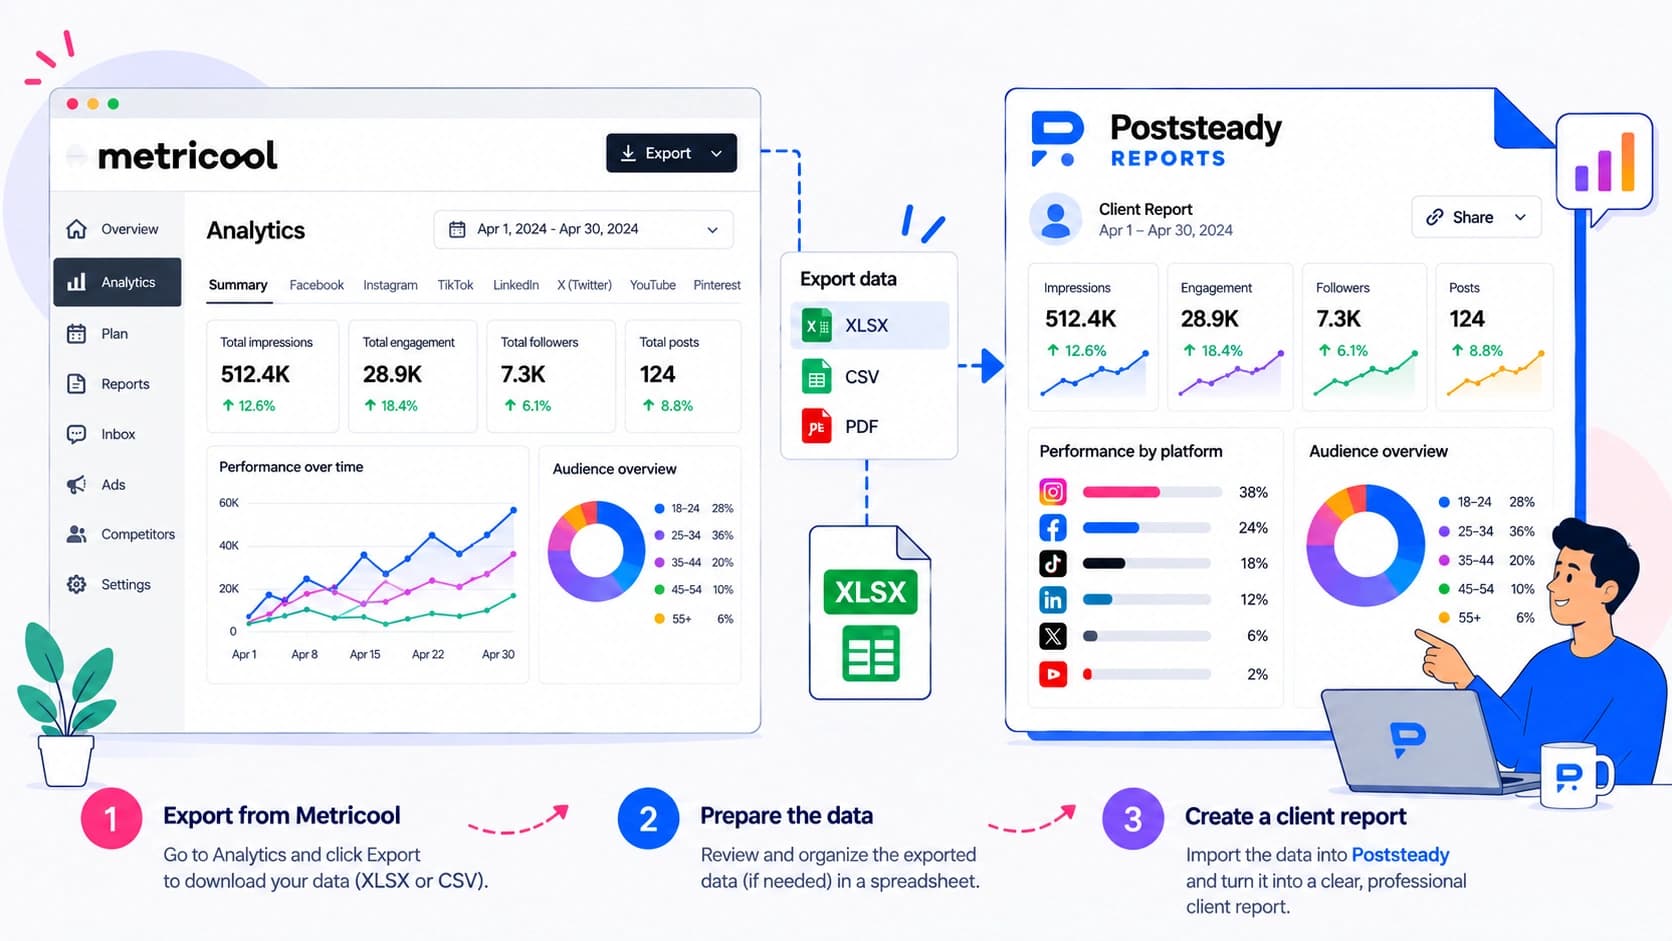
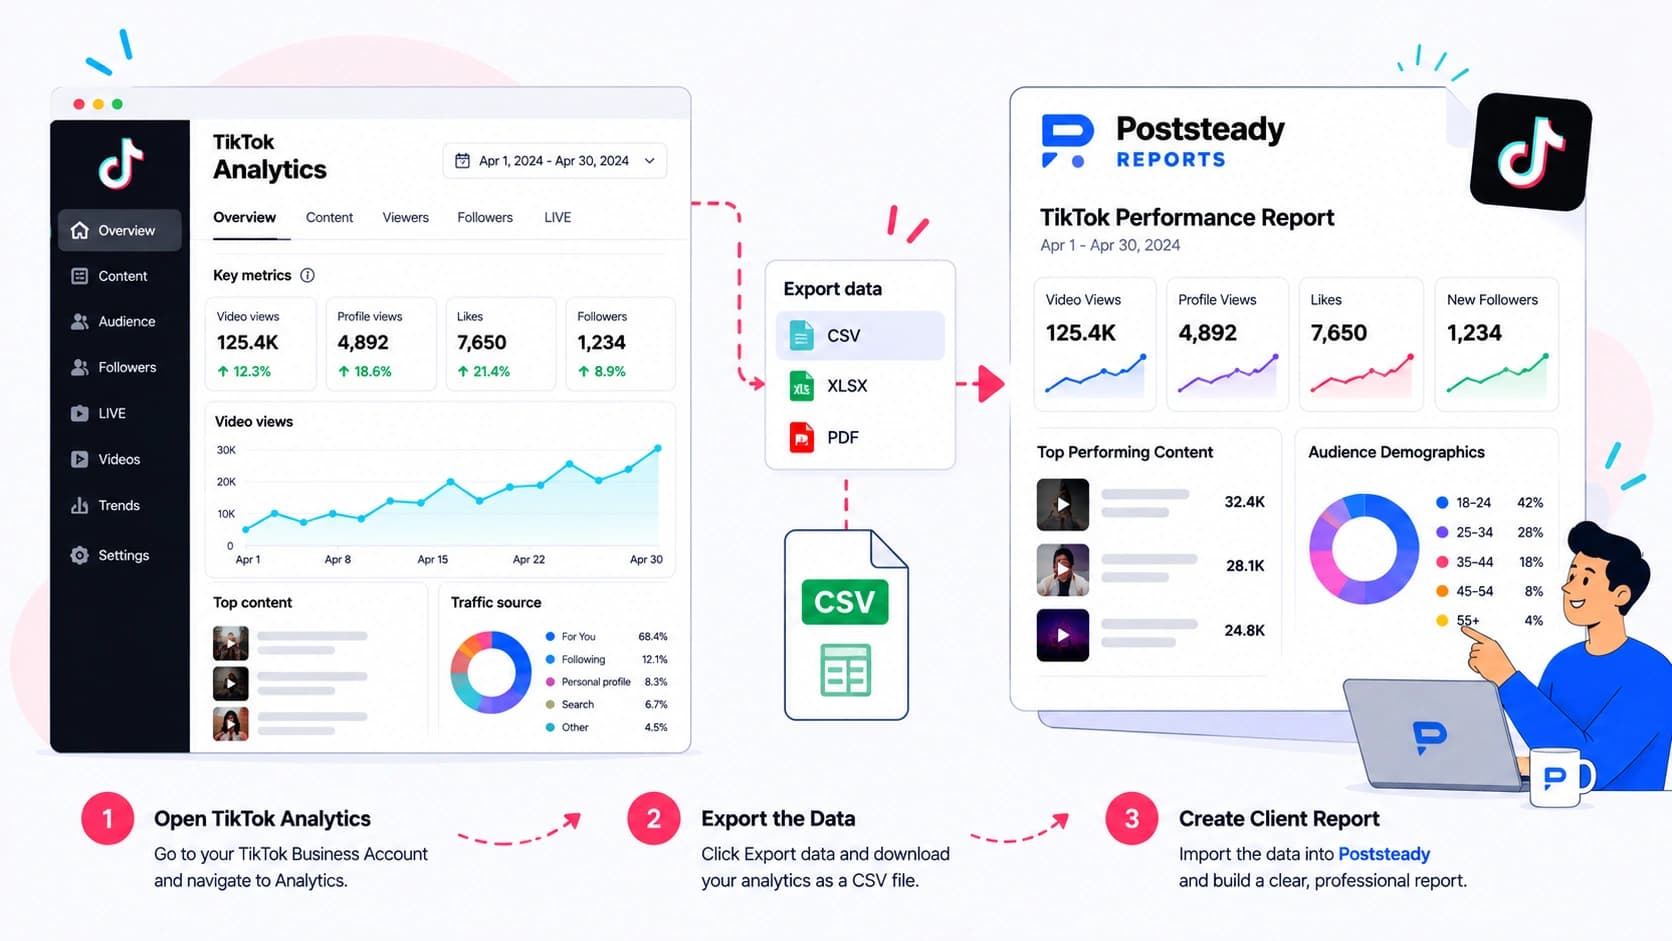
That's the part Poststeady takes. You upload the CSVs, it matches the columns to metrics, and you get a branded three-page report with the summary written for you to edit. On a Later file specifically, two things are worth knowing up front. First, Later isn't one of the export shapes Poststeady fingerprints by name — a Later file carrying Engagement Rate and Followers columns lands on the generic branch in lib/reports/auto-map.ts, which labels it "Social analytics export", so you set the platform yourself from the dropdown on the upload step. It's one click, and it beats a wrong guess.
Second, the column names themselves land cleanly. Reach, Followers, Engagements, Engagement Rate, Likes, Comments, Shares and Saves are all exact aliases in the mapping table, so Later's "Saves" column is claimed on the first pass with no retyping. A plain "Views" column goes to Video Views, deliberately: impressions has no "views" alias, because a column called Views is a view count and labelling it Impressions on a client's PDF is exactly the kind of quiet error nobody catches until the client does. The demographics and location files have nothing to map — there's no age or country metric in the schema — which is another way of saying keep those for the sentence you write, not the table.
Turn those exports into one client report
Upload the CSVs you just downloaded and get a branded three-page report, with the summary written for you to edit.