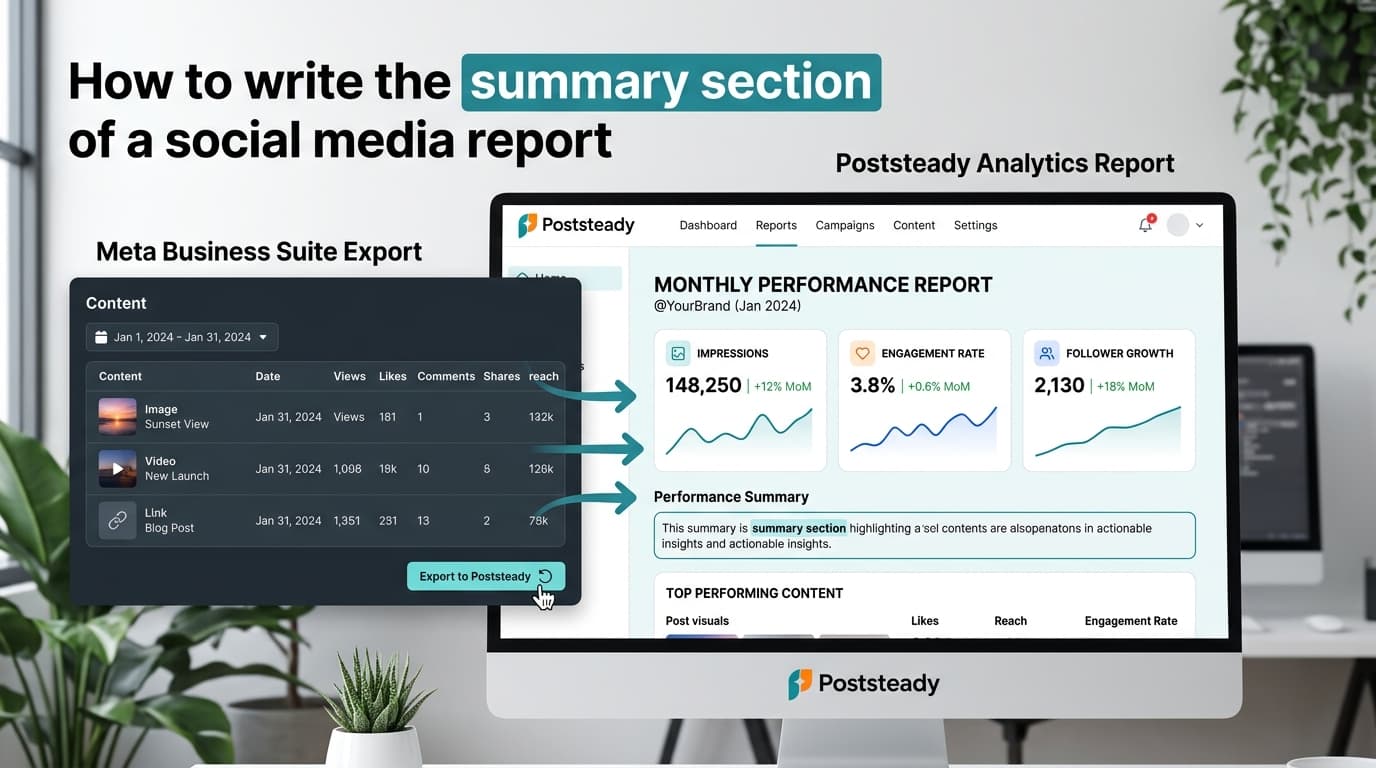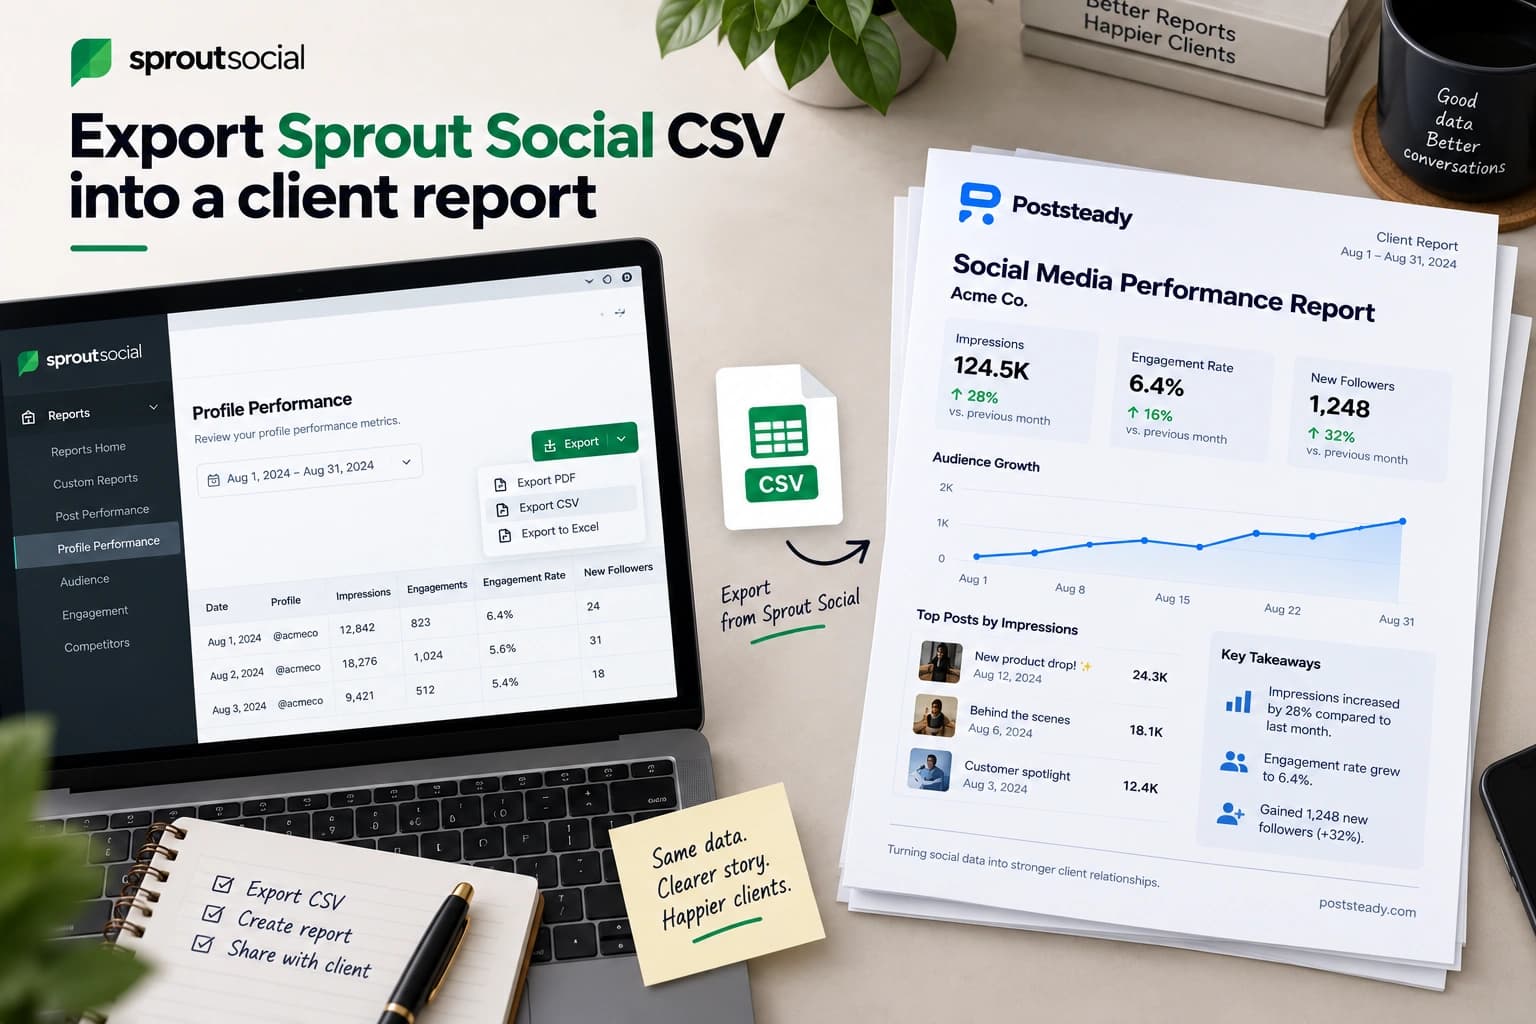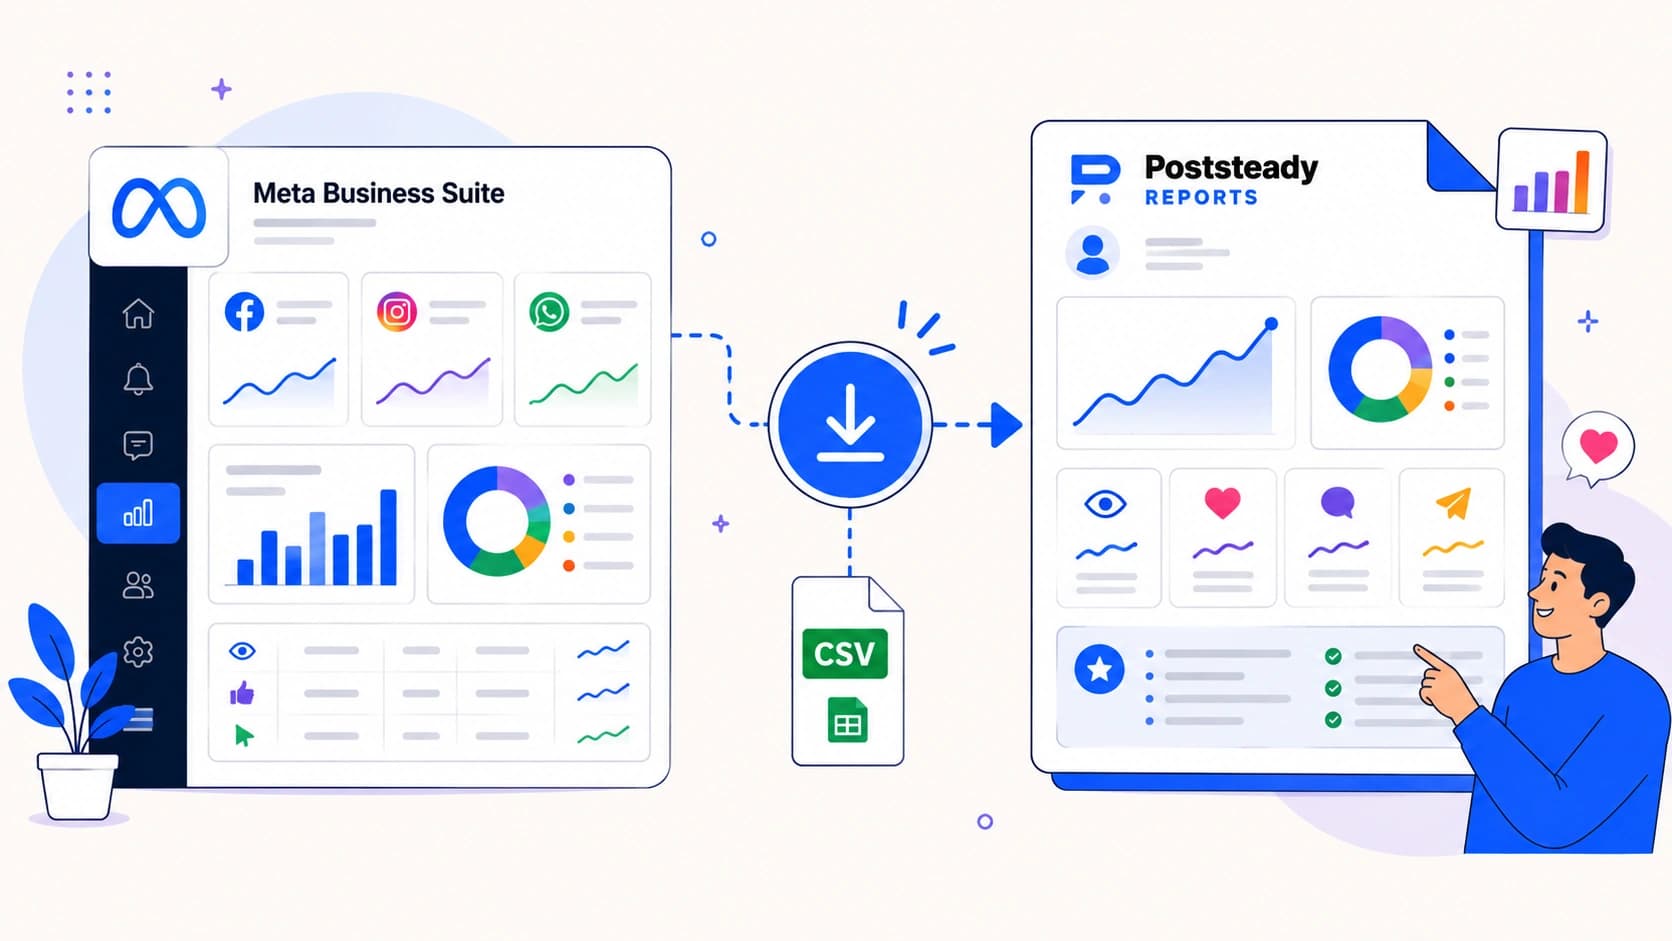

Meta Business Suite has an Export Data button on two different screens, and they don't produce the same file. Pull the wrong one and you'll spend twenty minutes wondering why the columns don't match last month's report.
Where the export button actually is
Insights lives in the left-hand navigation panel of Meta Business Suite. That's the hub for performance data across the connected Facebook Page and Instagram account. Once you're in there, the export control isn't in one global place — each section has its own.
On the Results screen, it's a blue Export data button in the upper-right corner of the main reach graph. On the Content screen, it sits just above the list of posts. Set your date range from the top right before you click, because the export honours whatever range is on screen — this is the step people skip, and it's why a file sometimes covers the last 28 days instead of the calendar month the client is paying for.
Worth knowing what Meta does not document: its own help page on exporting Page insights confirms the feature exists and gives the navigation path, but states no row cap and no limit on how far back you can export. So don't plan around a documented ceiling that isn't published — pull the range you need and check the file covers it.
Results or Content — pick the right one
Insights → Results gives you the Page-level roll-up: Page visits, Reach trend, an engagement overview for the period you picked. Good for the executive-summary numbers, useless for anything post-by-post.
Insights → Content gives you one row per post: Post Date, Post Text, Reach, Impressions, Likes & Reactions, Comments, Shares, Link Clicks. That's the file you want if the report breaks out top-performing posts, or needs engagement totals you can sum yourself rather than trust the Results roll-up for.
Both export as CSV. Both live under the same Insights menu. Neither export tells you which one you're holding once it's sitting in your downloads folder — rename it on the way out, or you'll be guessing later. The single habit that saves the most time here is a filename convention: client-month-results.csv and client-month-content.csv, decided once and never thought about again.
Which one you need depends on what the report promises. If your report has a "top three posts" section, you need Content. If it only carries period totals, Results is fewer rows and less to go wrong. Most monthly retainers end up needing both, which is fine — just don't try to make them agree with each other. More on that below.
When the file opens as gibberish
Here's the one nobody warns you about. Meta Business Suite's per-chart Export data — the one attached to an individual graph rather than the whole section — doesn't write a plain CSV. It writes UTF-16LE, prefixed with a sep=, line and a chart-title line before the real headers start.
The visible symptoms: the file opens in Excel as mojibake, or every row lands in a single column, or your first row of headers is the name of the chart rather than Date and the metric. None of that means the export failed. It means the file is encoded differently from what your spreadsheet assumed, with two junk lines on top.
If you're working by hand, the fix is to import rather than open — in Excel, Data → From Text/CSV, then set the file origin to UTF-16 and skip the first two rows. In Google Sheets, File → Import and let it detect the separator. What you should not do is retype the numbers because the file "looks broken", which is the usual improvised response and the one that introduces transcription errors into a client report.
A file that looks corrupted usually isn't. It's encoded for a different reader than the one you opened it with.
There's a second consequence of that file shape worth knowing if you also manage a YouTube channel: YouTube Studio's chart export writes a byte-for-byte identical structure — same UTF-16LE, same sep= line, same chart-title row, same Date column. Nothing inside either file distinguishes them. So if you keep both in the same downloads folder, the filename is the only thing telling you which platform you're holding. Rename on download.
What breaks a client report
- Results and Content don't share column names. "Reach trend" in one file isn't the same figure as summing "Reach" across every post in the other — Results counts the Page's total unique reach for the period, Content counts reach per post, and posts reaching the same people twice will double-count. Don't reconcile them to each other; pick one as your source of truth and say which in the report if it matters.
- Engagement rate isn't in either export. Meta Business Suite doesn't compute it for you, so it has to be derived from engagements and reach yourself — divide by whichever the client's other reports use, and stay consistent month to month rather than switching the denominator.
- The date range comes from the screen, not from the export dialog. Change it before clicking, not after, and check the first and last row of the file match the period you intended.
- A multi-month export will not split itself. If you pull three months in one file because it was easier, something downstream has to separate them — and summing three months into a box labelled with one month is the most expensive mistake on this list, because it looks plausible.
Facebook and Instagram in one workspace
If the client has both a Facebook Page and an Instagram account connected to the same Meta Business Suite, the account switcher at the top decides what you're looking at. Export with the wrong one active and you've built a Facebook report out of Instagram numbers, or the other way round.
This is easy to do and hard to catch, because both files have the same column names and both contain plausible numbers. The tell is usually magnitude — Instagram reach and Facebook reach for the same brand are rarely in the same range — but "it looked about right" is not a checking procedure. Confirm the switcher before every export, and put the platform in the filename.
For a report covering both, you want two separate exports, reported as two separate platforms. Averaging Facebook and Instagram into one "social" number hides the thing the client most needs to know, which is where the work is actually landing.
Turning the file into the report
Two CSVs, two sets of column headers, one of them possibly in UTF-16 — none of that is the report itself, just the price of getting the data out. The report is still the part that takes a night: pasting into slides, redrawing the charts, writing something the client will actually read.
Poststeady recognises a Meta Business Suite export on sight — a file carrying Post reach, Accounts reached or Post impressions fingerprints as one automatically — and maps the columns from either the Results or the Content export onto the report's metrics.
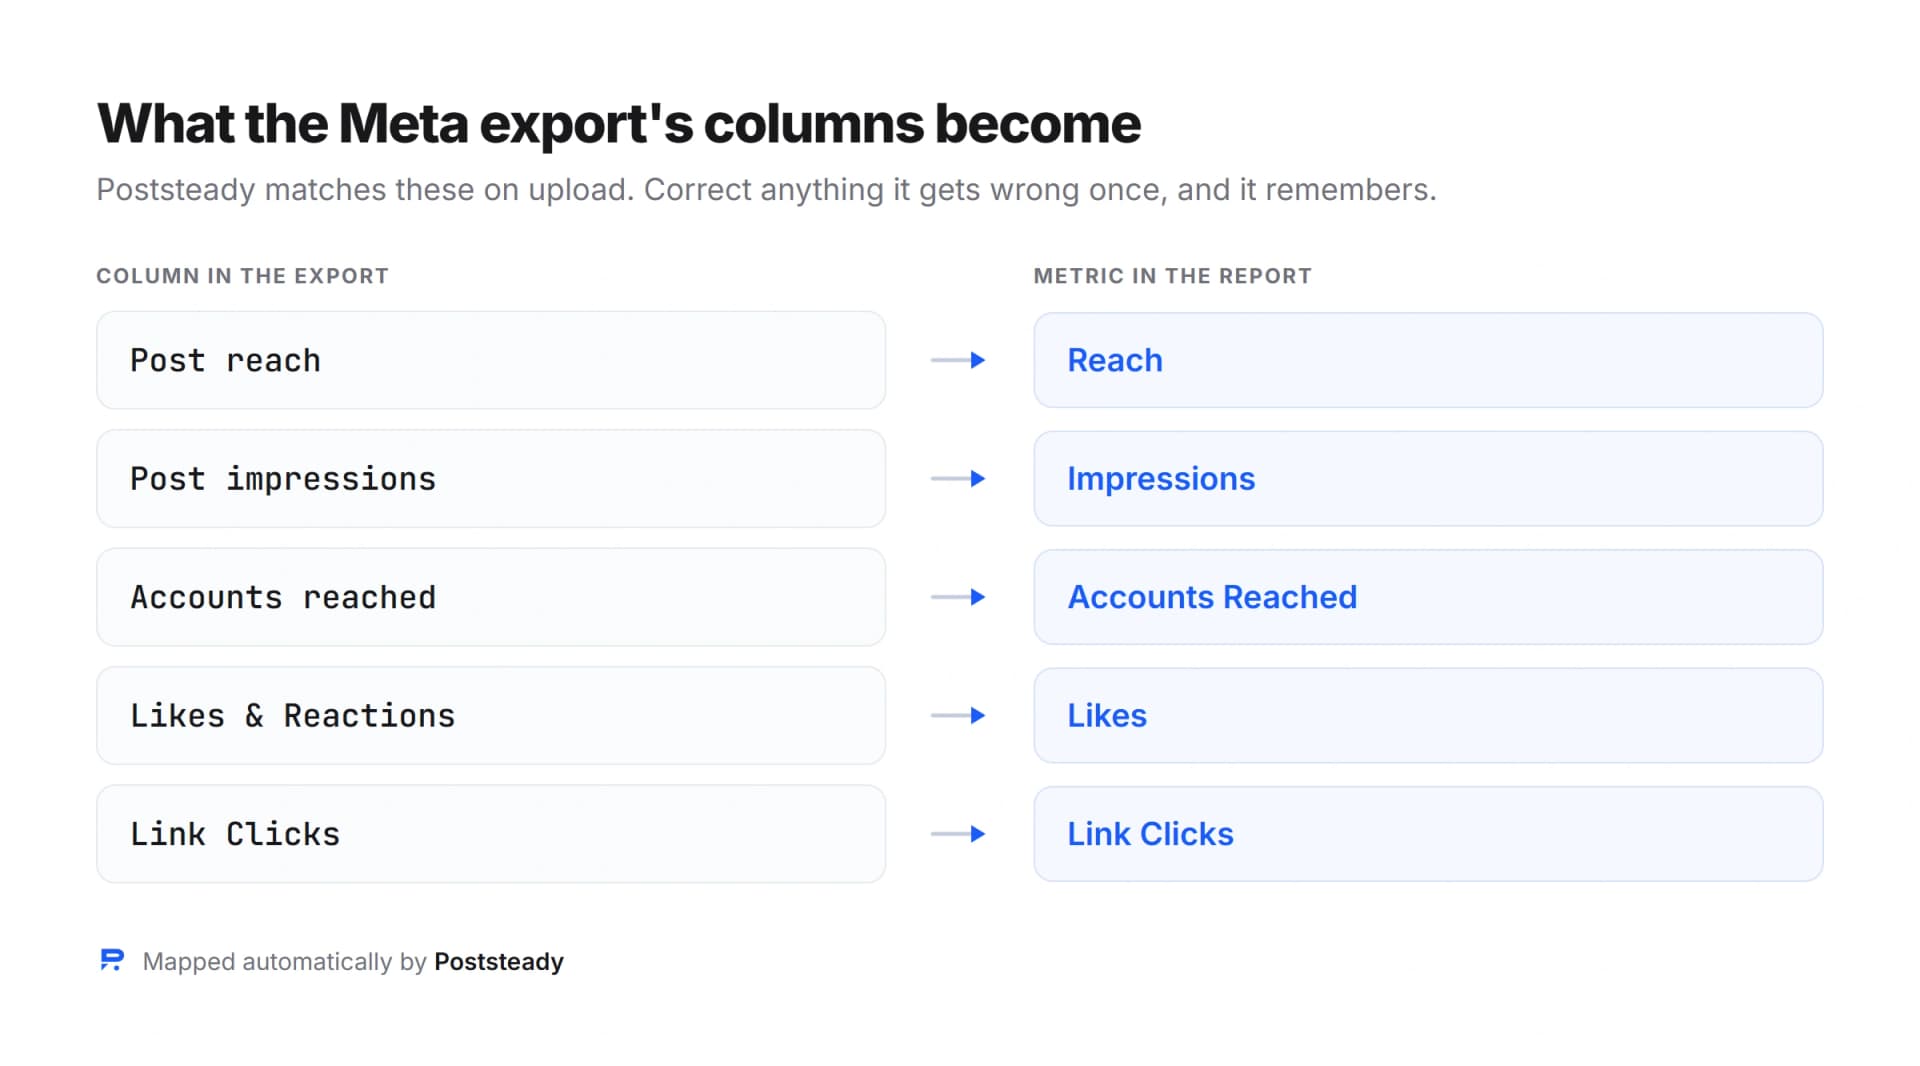
The UTF-16 problem is handled on the way in, so a chart export that opens as gibberish in Excel still imports as numbers. And no API access to the client's Page is required at any point — you're uploading the same export you already downloaded by hand.
The monthly checklist
- Check the account switcher before anything else — Facebook or Instagram, not whichever loaded.
- Set the date range from the top right first. The export follows the screen.
- Decide which file you need: Results for period totals, Content for post-by-post.
- Rename on download, with client, month and which export it is.
- If it opens as gibberish, import as UTF-16 and skip two rows. Don't retype it.
- Never reconcile Results against Content. Pick one source and name it in the report.
- Derive engagement rate the same way every month, or the trend is meaningless.
Seven steps, most of them ten seconds each, and they remove every recurring failure in this workflow except the writing — which is the part that was always going to be yours.
Turn that export into a client report
Upload the CSV you just downloaded and get a branded three-page report, with the summary written for you to edit.