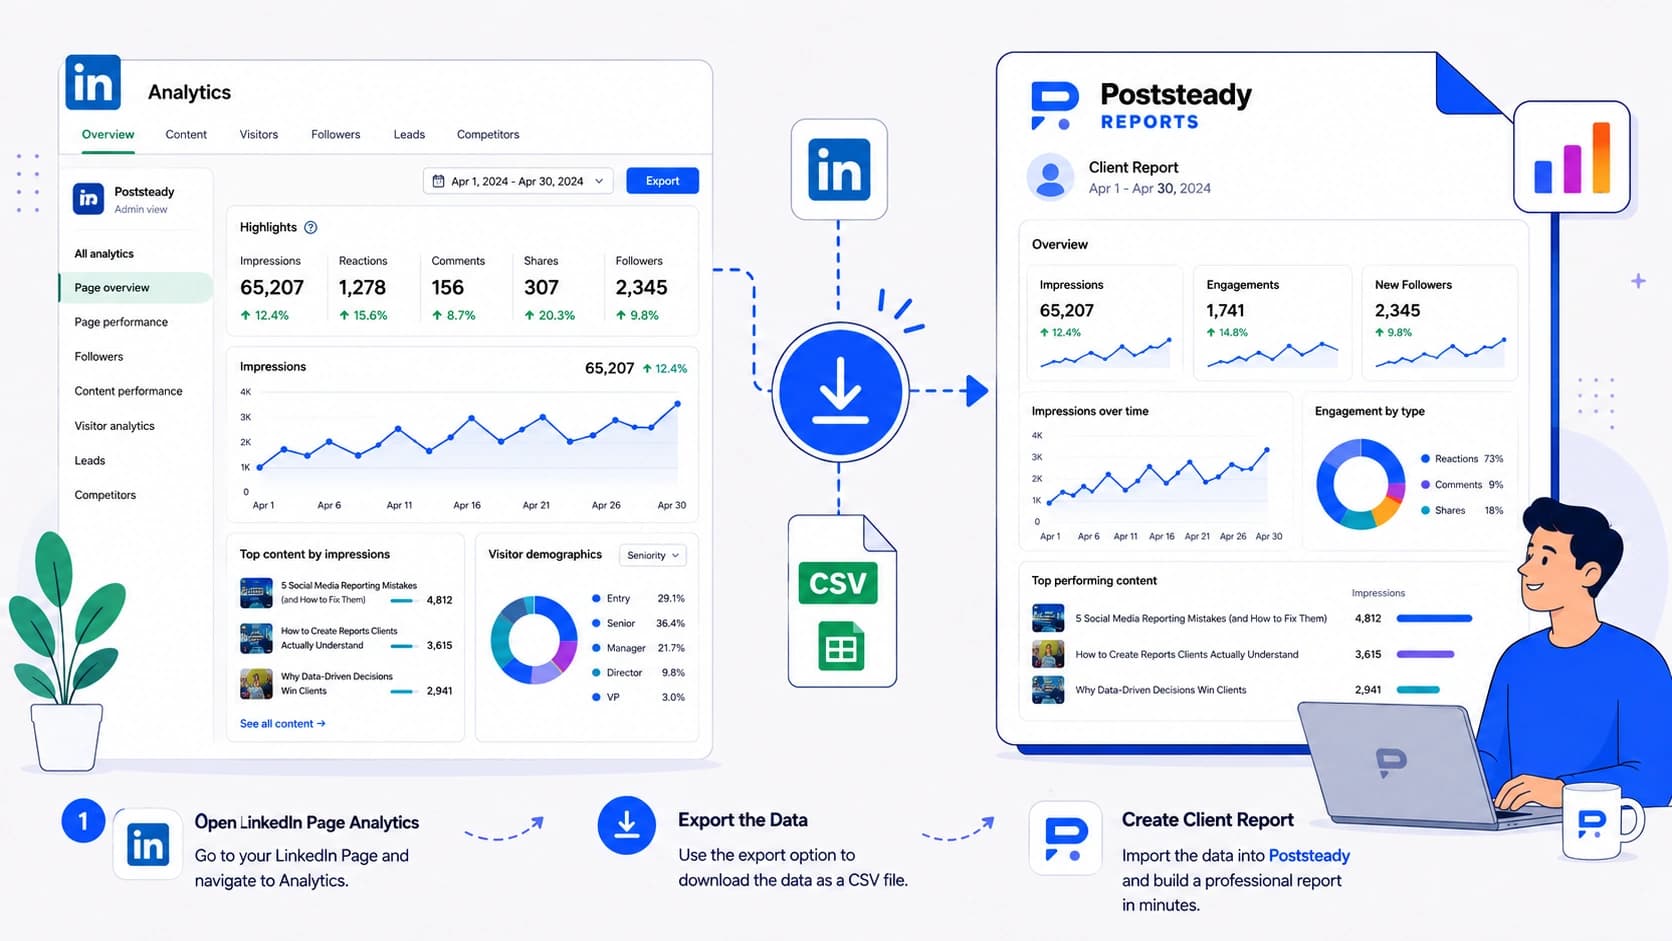
LinkedIn's Page analytics export is the only one of the big four that doesn't hand you a CSV. It hands you an XLS file, split across four categories you have to download one at a time.
Where the export button lives
You need admin access to the Page, not just a personal profile. From the Page admin view, open Analytics in the left menu, then pick a category — Visitors, Content (called Updates in the file), Followers or Competitors. Each one is its own screen with its own Export button in the top right.
Click Export, choose a date range, click Export again. What downloads is an XLS spreadsheet, not a CSV — and there is no setting anywhere that changes that. If the report tool you're feeding it only takes CSV, you open the file and use Save As, or drop it into Google Sheets and download that as CSV. It's an extra step every other platform in this series skips.
What's actually in the file
Four separate downloads, four separate files, and none of them share a shape:
One row per post: impressions, clicks, CTR, reactions, comments, shares, follows and engagement rate, each split into organic and sponsored (total) columns.
Total followers, organic followers, sponsored followers, plus a demographic breakdown by location, job function, industry, seniority and company size.
Page views and unique visitors, broken out by the same demographic categories as Followers — no engagement numbers live here.
There's a fifth category, Competitors, but it's benchmarking against other Pages, not your own numbers — nothing to pull into a client report from that one.
The three things that trip people up
- Organic, sponsored and total sit side by side as separate columns on almost every metric. Grab the organic impressions column when the Page also ran sponsored posts that month, and you've quietly reported a fraction of the real reach.
- "Unique impressions" is LinkedIn's name for reach — it's the count of distinct members who saw a post, not a running total of views. There is no column literally labelled Reach.
- The four files use different date pickers and don't line up automatically. Pull Updates for 1–30 June and Followers for a slightly different window, and your engagement rate is quietly dividing by the wrong follower count.
Turning the file into the report
Four spreadsheets is already more than most clients want to see, and none of them say whether the month was good. That's still a separate write-up — pasting the Updates tab into a deck doesn't answer the one question a client actually has.
Skip stitching four files together by hand
Save the exports as CSV and upload them — Poststeady maps the organic/sponsored/total columns onto reach, impressions, engagement rate and followers automatically.
Poststeady recognises a LinkedIn export by its column shape — the organic/sponsored/total split is distinctive enough that it fingerprints on its own, no filename guessing involved. It maps the total columns onto reach, impressions, engagements, engagement rate, clicks, follower growth and video views by default, since total is what a client actually cares about. Anything it gets wrong you correct once on the mapping screen, and it remembers the correction for next month's file.
Follower growth is the one metric allowed to go negative — a Page can genuinely lose followers in a month. Every other number gets treated as bad data if it shows up negative, which is usually a sign you pulled the wrong column.
Turn four exports into one report
Upload the CSVs and get a branded three-page report, with the summary written for you to edit.