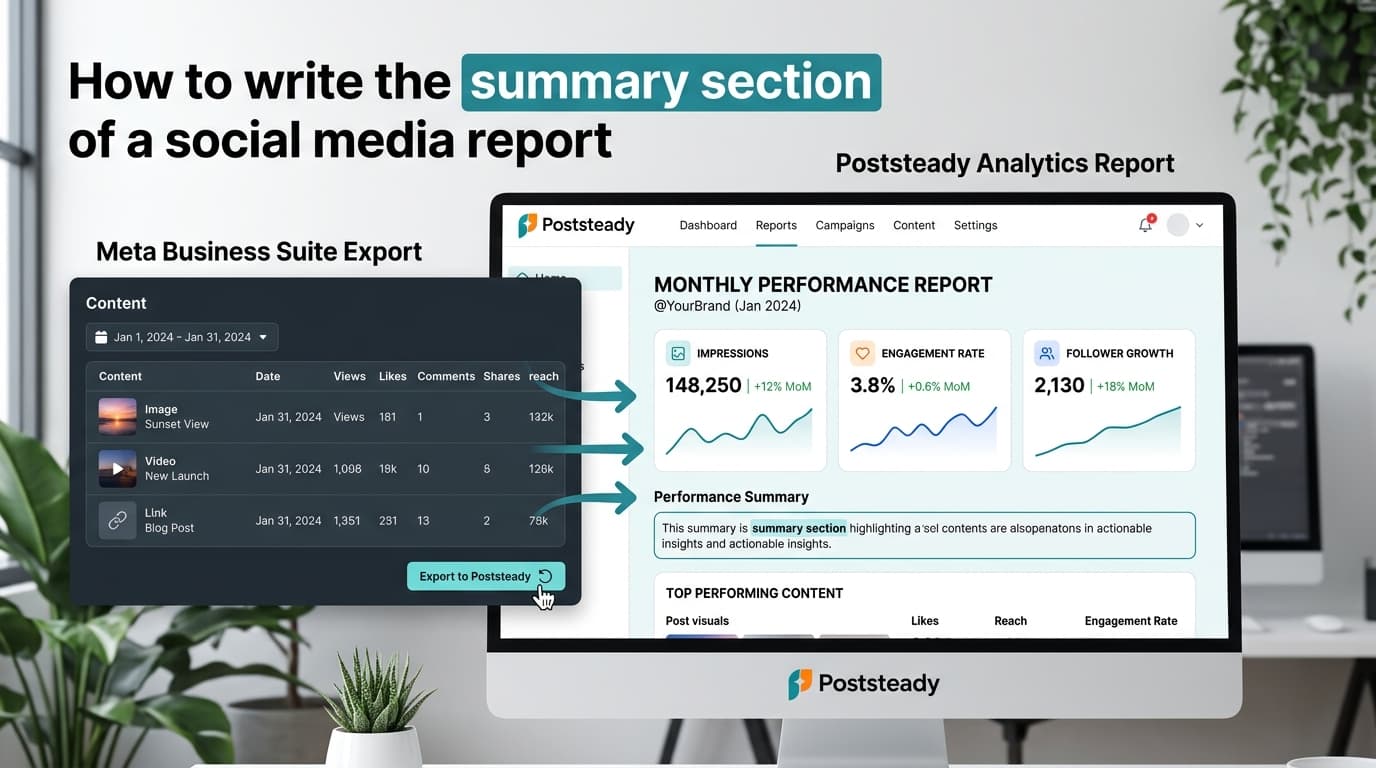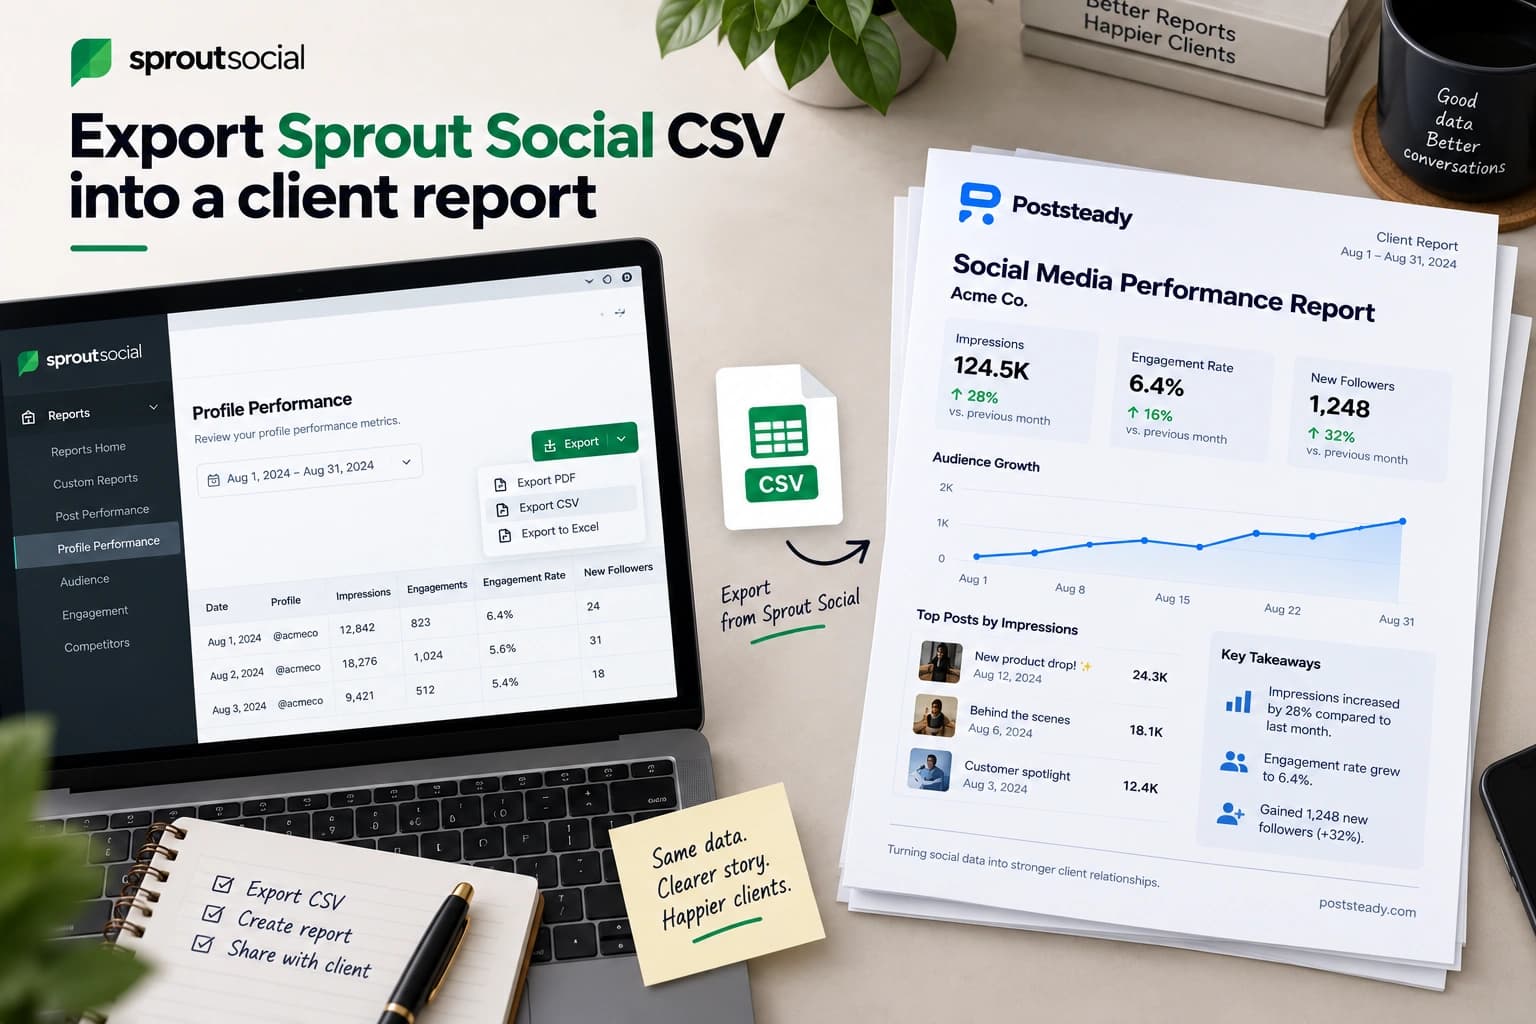

Instagram has no export button. The one that works is in Meta Business Suite, three menus deep, and it hands you a CSV that looks nothing like the Insights screen you were just reading.
Why you have to do this monthly
Before the how, the reason it's urgent: Instagram keeps account and content insights for 90 days. After that the data is gone, and there is no recovery path — not a support request, not a paid tool, not an API call. Instagram Stories are the one exception, retained for around two years.
For a monthly client report that sounds survivable, and for the current month it is. Where it hurts is the year-over-year comparison a client asks for in month nine, or the "how did we do before you took over" question at a pitch. If nobody exported, that history does not exist anymore. The first thing to do on a new account is not to build the report — it's to pull the last 90 days and save it somewhere, because that's the only window you will ever get.
This also settles a debate people have with themselves about whether monthly reporting is worth the effort on a small account. The export is worth doing even if you skip the report that month. The file is cheap to produce and impossible to recreate later.
Where the export actually lives
First requirement: the account has to be a Professional account, Business or Creator. Personal profiles have no Insights and nothing to export. If a client swears the numbers are there and you can't find them, this is usually why — and switching account type is something they have to do, not you.
The path is Instagram → More → Meta Business Suite → Insights → Content, then Export Data in the top right. Pick the account, the date range, and whether you want posts or stories. Hit Generate, wait for it to process, then download. What lands is a CSV rather than a PDF, which is the entire point — a CSV is still workable.
Two details to get right at this step. The account picker matters if the client has a Facebook Page in the same workspace, because both are one click apart and the files look similar enough to confuse later. And posts and stories are separate exports — if the client's strategy leans on stories, one export gives you half the month's work.
What's actually in the file
This is the part every other guide skips. They tell you which buttons to press and stop at the download, as if the file explains itself.
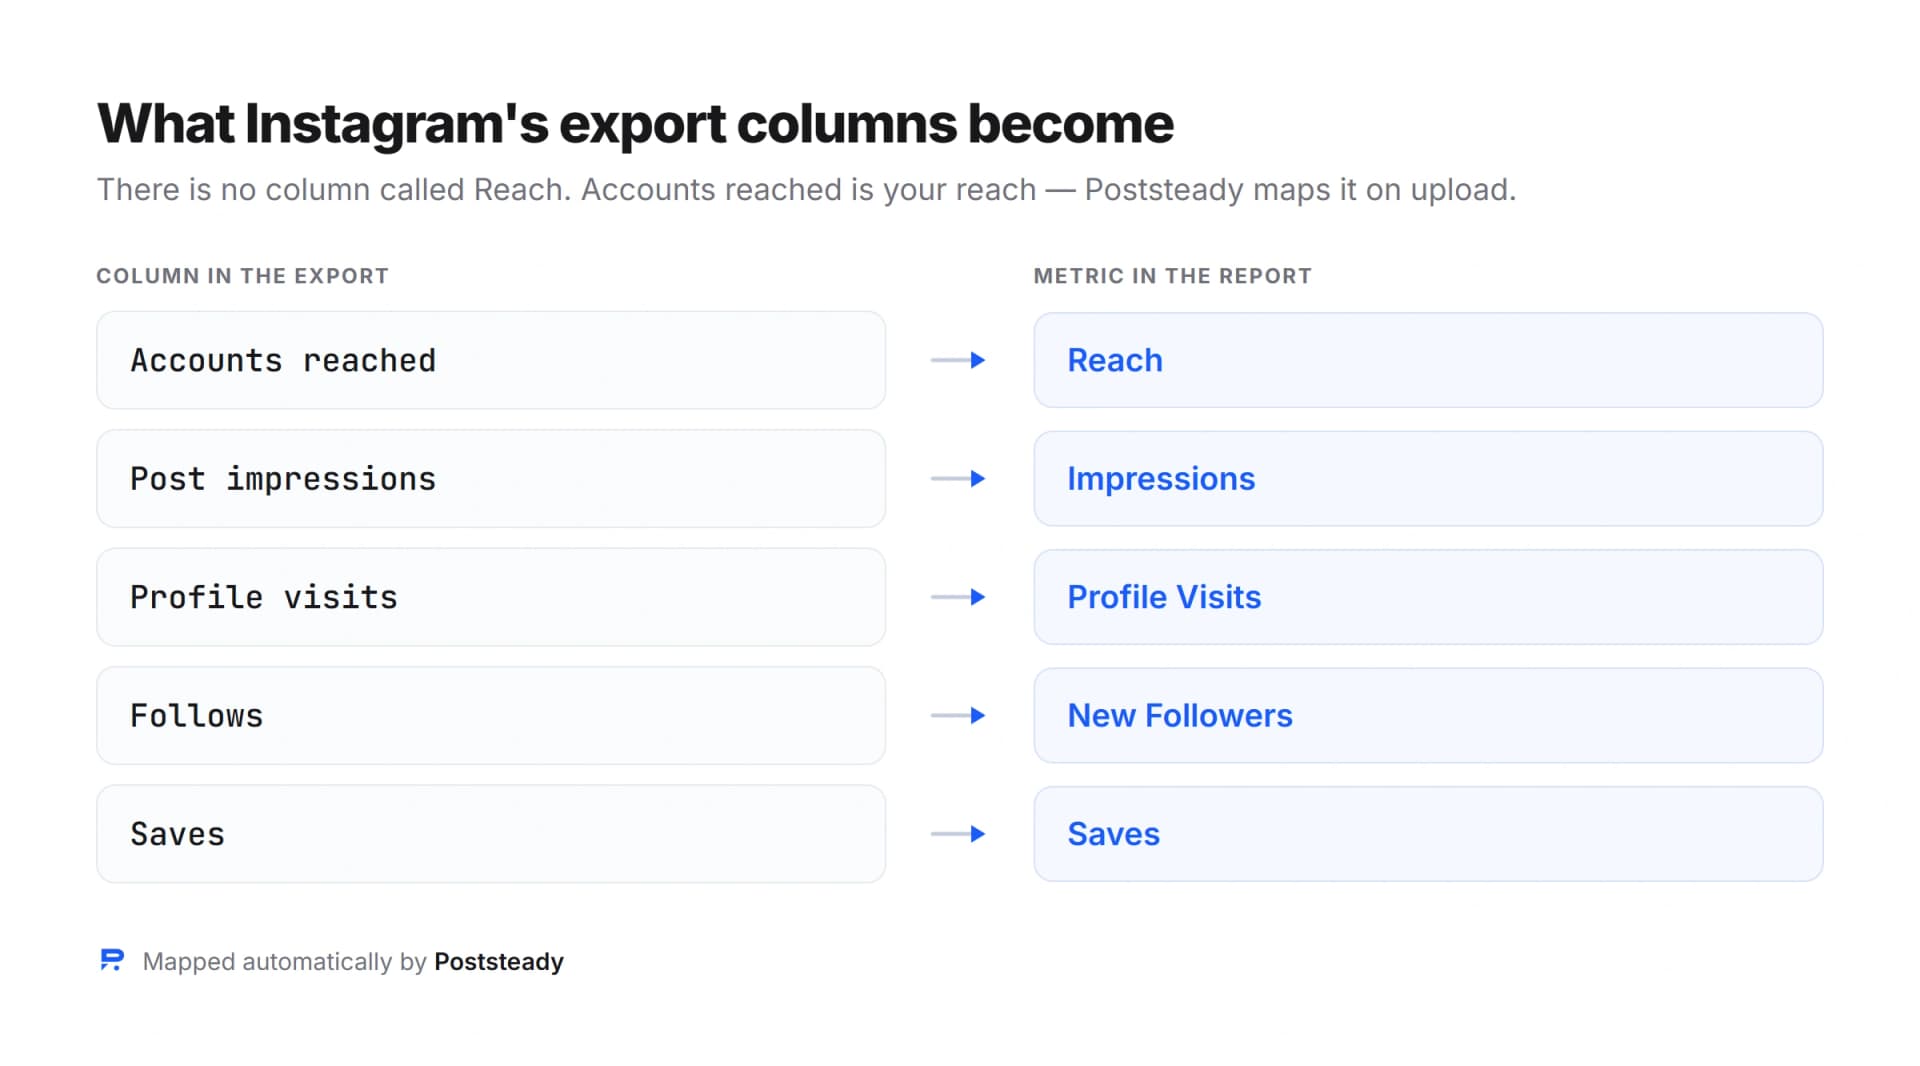
It doesn't use the friendly words from the Insights screen. Depending on the report you pick, the headers read more like: Accounts reached, Post impressions, Profile visits, Follows, Saves, Shares, Comments, Likes, and for video, Plays or Reel plays.
Two things catch people out. There is no column literally called Reach — "Accounts reached" is your reach. And likes can arrive as Reactions, shares as Reposts, depending on which export you generated. The words move around between exports. The numbers underneath don't.
The practical consequence is that you cannot build a spreadsheet template that references columns by position or exact name and expect it to survive. Next month's file may name the same quantity differently, and a formula pointing at the wrong header fails silently — it returns a number, just not the one you meant.
The columns that break a report
Three worth checking every single month, because each one fails quietly rather than loudly:
- Net followers is a signed number. If the client lost followers, it's negative — and plenty of spreadsheets and tools silently discard negative values, so a bad month renders as no follower data at all instead of as a decline. A month that looks like it has no follower data usually has bad follower data.
- Organic, paid and total often sit side by side as separate columns. Grab the organic one by accident and you've reported a fraction of the month, understating your own work.
- Engagement rate travels badly. Every tool divides by something slightly different — some by reach, some by impressions, some by followers. Safer to derive it from engagements and reach yourself, so the rate agrees with the two numbers printed next to it.
The first one deserves emphasis because of how it presents. You don't get an error. You get a report with a blank where follower growth should be, in the exact month a client is most likely to be scrutinising it. If your follower figure ever renders as empty rather than as a number, assume a negative got swallowed rather than assuming the data was missing.
Getting from CSV to a report you can send
It's worth being precise about what the export is and isn't, because the two things get conflated. Meta Business Suite lets you download Instagram analytics data. It does not produce an Instagram analytics report. Those are different objects: one is a grid of numbers with internal column names, the other is a document with your branding on it that a client reads once and understands.
Everything between those two objects is your labour. Choosing which of the forty columns matter. Working out which figure answers the question the client actually asked. Writing the sentence that explains why reach fell but saves doubled. No export button does any of that, which is why the download is the easy fifteen minutes and the report is the evening.
Accounts reached: 18,402. Post impressions: 31,205. Saves: 412. Profile visits: 1,905.
Reach was 18,402 — down 8% on last month because we posted four fewer times. But saves rose 34%, which is the signal worth acting on: the carousel format is doing the work, so next month shifts toward it.
The second version uses the same numbers. The difference is that it answers "compared to what" and "so what", and those two answers are the entire reason the client is paying for a report rather than a screenshot.
Turning the file into the report
Downloading the CSV was never the hard part. The hard part is that no client wants a spreadsheet. They want one sentence about whether the month was worth the money, with the numbers standing behind it.
You can do that by hand — paste into Slides, rebuild the charts, retype the numbers, write the summary at 11pm. That's the traditional answer and it's why reporting swallows a day you didn't bill for.
Or you push the CSV into something that already knows these column names. Poststeady recognises the export format automatically: a file carrying Accounts reached or Post impressions fingerprints as a Meta Business Suite export, and the columns map themselves onto the report's metrics.
No API access to your client's account is required at any point — you already did the export by hand, and that file is the whole input.
Follower growth is the one metric Poststeady allows to go negative — a real month can lose followers, but it can't lose impressions. Everything else gets treated as bad data if it shows up negative, which is the guard against the silent-blank failure described above.
The monthly checklist
- Export every month without fail. Instagram deletes insights after 90 days and there is no recovery.
- On a new account, pull the full 90 days on day one before anything else.
- Confirm the account is Professional — Business or Creator. Personal has no Insights.
- Check the account picker: Instagram, not the Facebook Page sitting next to it.
- Export posts and stories separately if stories are part of the strategy.
- Remember there is no Reach column. Accounts reached is your reach.
- If follower growth renders blank, suspect a swallowed negative, not missing data.
- Derive engagement rate from engagements and reach, the same way every month.
The export takes four clicks. The discipline of doing it every month, even in the months you don't report, is what gives you a year of history to point at when someone finally asks for it.
Turn that export into a client report
Upload the CSV you just downloaded and get a branded three-page report, with the summary written for you to edit.