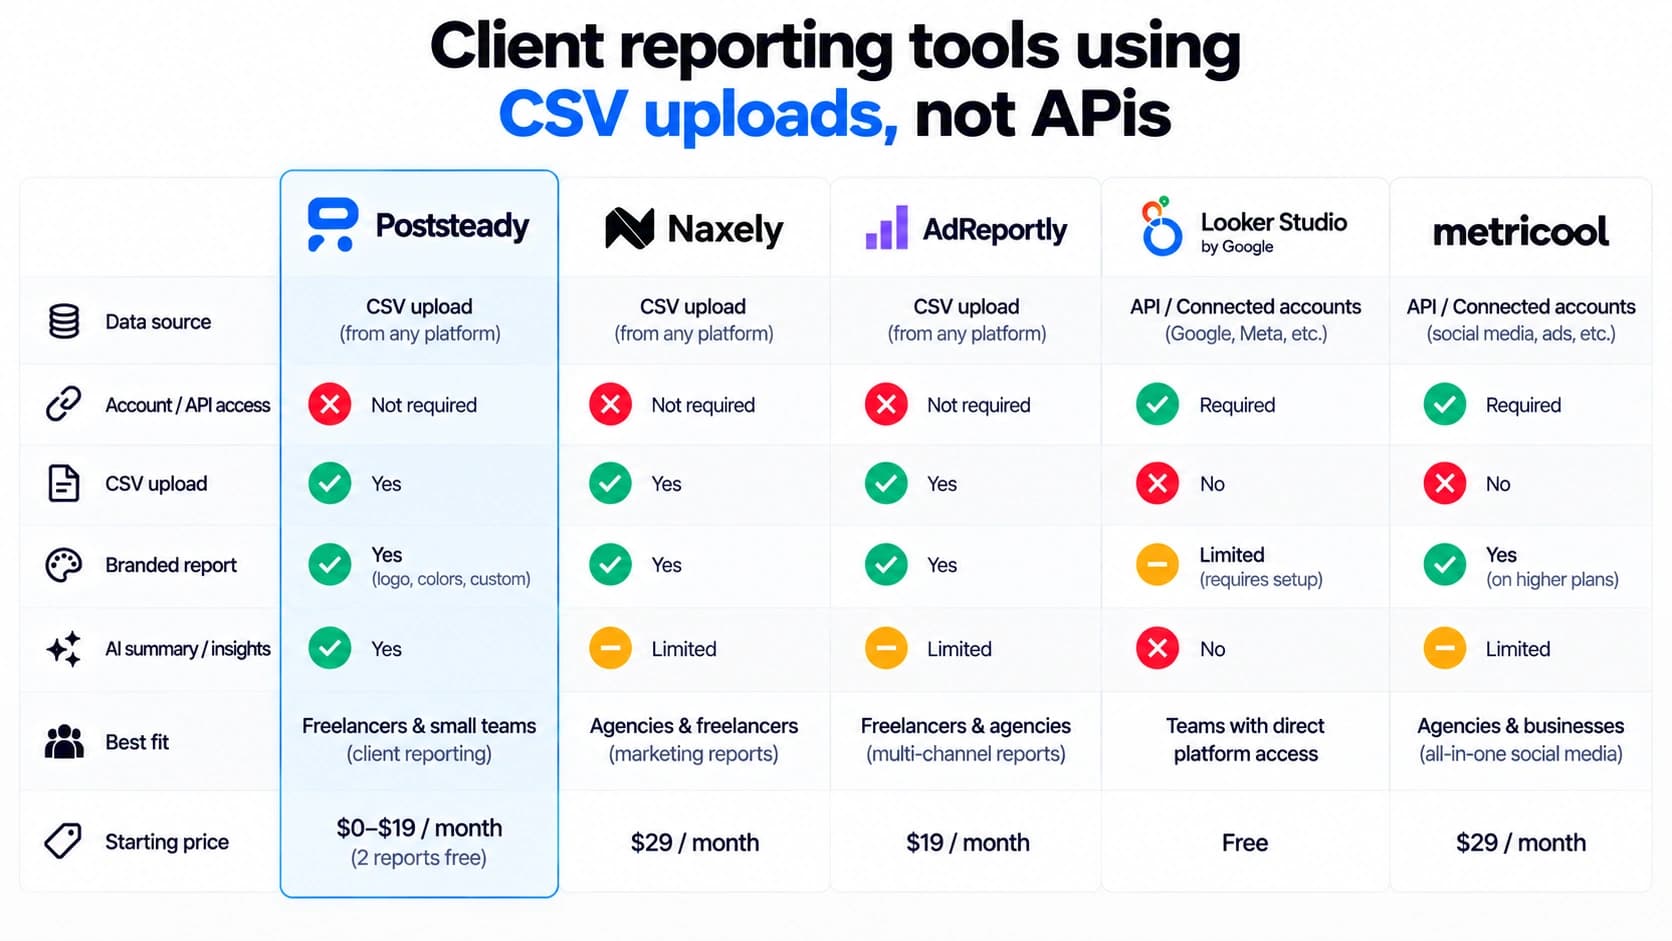

Most client reporting software demands API access to your client's business manager. If you don't have that access, or the platform changes its API terms, you're stuck manually pasting numbers into a spreadsheet. Here is how to build reports directly from the CSV exports you already download.
The problem with API connections
Connecting a reporting tool to a social platform API sounds like the easiest way to pull numbers. But for freelance social media managers, it introduces a hard roadblock: permission. You have to ask the client to authenticate the connection, or you have to be granted admin rights to their Meta Business Suite or LinkedIn Campaign Manager. Sometimes clients are slow to do this. Sometimes their own access is tangled up in old agency accounts.
Even when it works, APIs break. A platform changes its terms, a token expires, and suddenly your live dashboard reads zero across the board.
Dashboard tools that take CSVs
There are reporting tools that accept CSV uploads instead of requiring an API. DashThis, Megalytic, Databox, and even Microsoft Power BI all support uploading custom data. But they are primarily dashboard builders. When you upload a CSV to them, you usually have to manually configure how each column maps to a custom widget on a blank canvas. You are piping data into a visual builder, which takes time to configure for every new client.
A tool built entirely around the CSV
Poststeady is built from the ground up for the CSV export. There is no API integration at all. You take the analytics export you already download from the platform, upload it, and get a finished, three-page PDF report branded to your business.
Because it isn't trying to be a live dashboard, it doesn't just chart the numbers. It reads your uploaded data and writes an executive summary and strategic recommendations for you, which you can edit line by line. The report explains what happened, rather than just showing it.
How the mapping actually works
When you drag in a file, Poststeady automatically recognizes the export format. It fingerprints 7 different sources by looking at the column headers — including Meta Ads Manager, Google Ads, TikTok Ads Manager, LinkedIn Campaign Manager, Meta Business Suite, and generic social analytics exports.
From there, it knows exactly what the columns mean. It automatically maps 175 different column aliases to 21 stored metrics (like reach, impressions, spend, and conversions). For example, it knows that "Amount Spent (USD)" in a LinkedIn export and "Cost" in a TikTok export both mean the same thing. It also calculates 6 derived rates for you, like engagement rate and ROAS.
You confirm the mapping on a single screen. If you ever need to correct a column, that mapping saves as a reusable preset, so next month's upload lines up on the very first try. You review the numbers, edit the written analysis, and send the PDF. Data in Monday, report out before lunch.
Try the CSV-first workflow
Upload your exports and get a branded three-page report. Free for two reports a month.